Manual Annotation (manual)
manual is the manual annotation branch under annotation. It maps clusters to interpretable celltype labels and writes the result back to the analysis object.
Unlike annotation_help, which provides evidence for interpretation, manual does not infer new annotations automatically. Instead, it implements a standardized workflow of “you provide the mapping table, and the pipeline writes the labels back and exports the results.”
The main evidence used for manual annotation is the marker_genes_pval.csv table generated in annotation_help. You can combine that table with the marker dotplot and the literature to evaluate whether canonical marker genes are strongly expressed in the expected clusters.
Workflow overview
Read the downstream object listed in the second column of
sample.txt(.zarror.h5ad).Read the annotation mapping file and parse the relationship from
clustertocelltype.Map
obs['clusters']toobs['celltype']and write the result back into the object.Export the UMAP plot, composition plot, spatial overlay plot (except for
slide_seq), and annotation table.Generate the
annotation-stage object for downstream comparison or further analysis.
This is a lightweight module designed to integrate annotated cell-type information into the zarr data object. Please ensure that you have completed clustering and that the obs['clusters'] field has been generated. We use the demo data for this demonstration. For other scenarios, simply adjust the necessary parameters and the annotation.txt mapping file according to your own experience.
Prepare the mapping file annotation.txt
The current implementation skips the first line and reads the second line as the annotation content. The second line is comma-separated, and the order corresponds to cluster 0,1,2....
The example below shows a rough annotation of Colon_cancer_P1 based on the reference figure from the original paper and is intended for demonstration only.
sample 0 1 2 3 4 5.........please input anno by order of cluster
Intestinalepithelial,Intestinalepithelial,Myeloid,Fibroblast,Tcells,Endothelial,Smoothmuscle,Tumor,Fibroblast,Unknown,Unknown,Unknown,Unknown,Unknown,Smoothmuscle,Tumor
The example maps cluster IDs to cell types in order. If your clustering contains more IDs, continue listing them on the same line.
spatialsnake single_analysis sample.txt visium_HD --option=annotation --anno_algorithm=manual --annotation-file=annotation.txt
Result file structure
This example shows single-sample manual annotation for visium_HD. Before interpreting the results, first confirm that {sample}.zarr and *_cell_clusters.csv have been generated, then check whether the figures support your annotation decisions.
results/
└── Colon_cancer_P1_008um/
    └── annotation/
        ├── Colon_cancer_P1.zarr/
        ├── celltype_proportion.png
        ├── Colon_cancer_P1_UMAP.png
        ├── Colon_cancer_P1_gene_enrich.png
        ├── Colon_cancer_P1_Clusters.png
        ├── Colon_cancer_P1_cell_clusters.csv
        └── ...
Colon_cancer_P1.zarr is the main object reused in downstream analysis. Colon_cancer_P1_cell_clusters.csv is the exported label table used for external review or other downstream tools.
If run_type=xenium, the exported filename becomes *_cell_groups.csv.
Scenario |
Recommended command |
|---|---|
Single sample (Visium HD, shown in this tutorial) |
|
Single sample (standard |
|
Single sample ( |
|
Manual annotation of an integrated multi-sample object |
|
Parameter category |
Recommendation for single-sample analysis |
Recommendation for multi-sample or cross-condition analysis |
|---|---|---|
Annotation mapping file ( |
Fill it completely in cluster order and cover the major populations first |
Start with a unified naming system on the integrated object, then refine sample-specific differences |
|
Start with the default layers to generate figures quickly |
Keep the same layer types across all samples to reduce visualization bias |
|
Usually keep it disabled and inspect the full tissue first |
Enable it only when reviewing a target region and record the crop coordinates for reproducibility |
manual reads downstream object paths rather than raw sequencing directories. We recommend storing the object path from clustering or a later stage in the second column of sample.txt.
Analysis mode |
Input |
Output |
|---|---|---|
single_analysis (standard |
|
|
single_analysis ( |
|
|
single_analysis ( |
|
|
compare_analysis |
|
|
Interpreting the results
1. Annotated UMAP
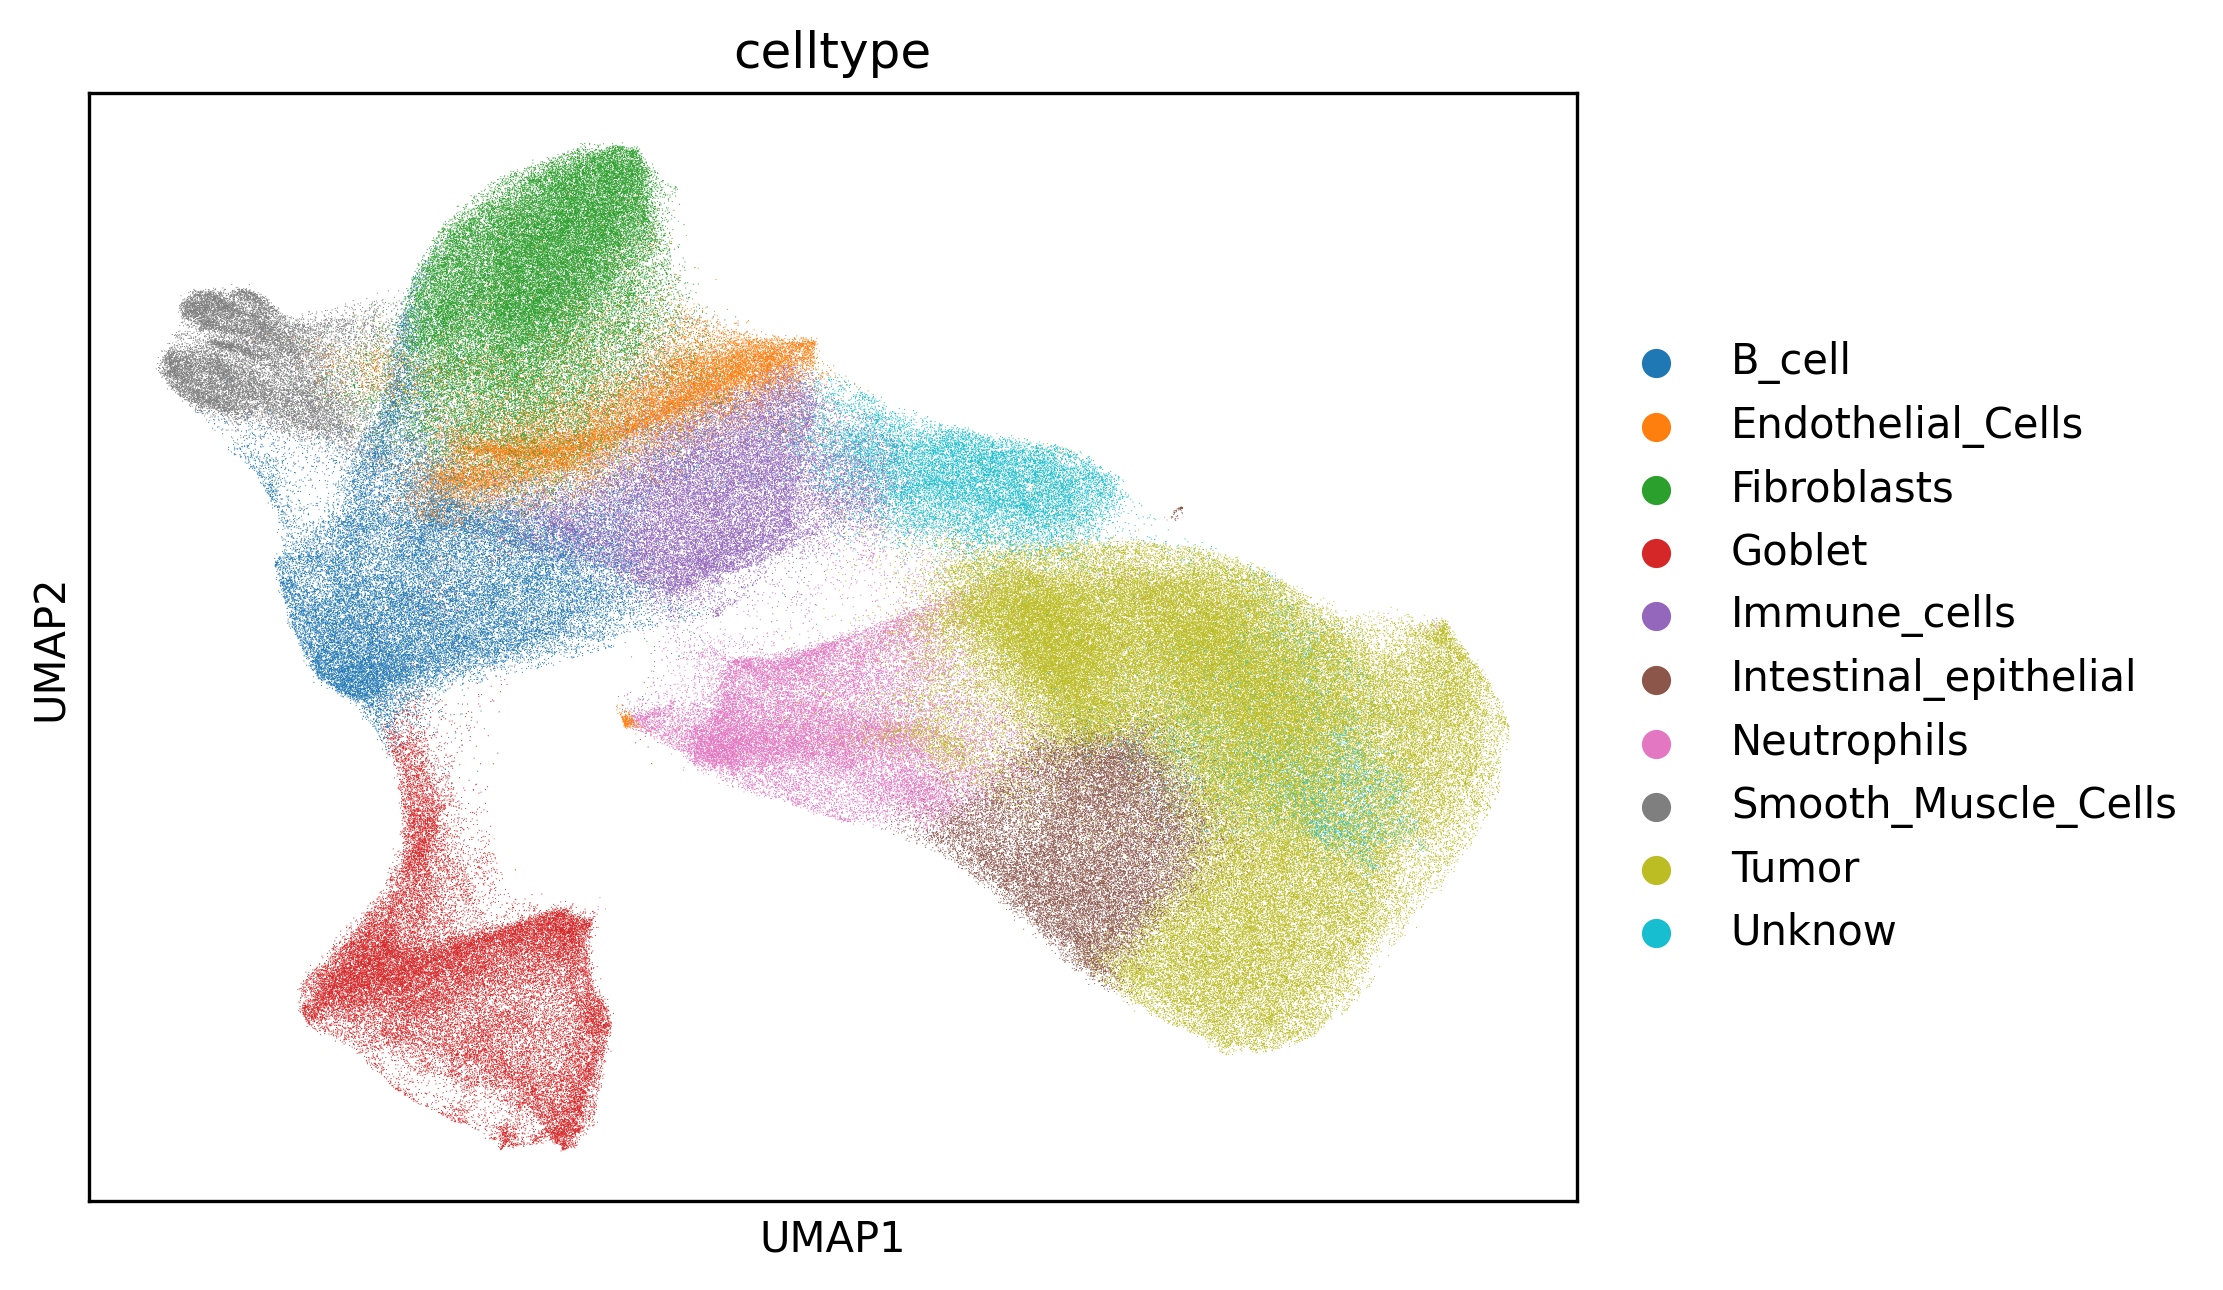
Interpretation:
UMAP is mainly used to inspect the separation and transitions among mapped celltype labels in low-dimensional space. If several cell types overlap strongly without a meaningful transition pattern, the annotation granularity may not match the clustering granularity.
Suggestion:
First check whether biologically distinct clusters were merged into the same celltype in the mapping file. If needed, adjust the cluster structure before reapplying the mapping.
2. Spatial overlay plot
Example output:

Spatial celltype map used to evaluate whether the annotated cell types show coherent spatial structure and plausible boundaries in the tissue.
Interpretation: This plot helps determine whether the annotated cell types occupy biologically reasonable positions in tissue space. If one type appears as scattered noise and does not match tissue histology, misannotation or cluster noise should be considered.
Suggestion: Evaluate spatial coherence together with the UMAP structure, and finalize the naming only when both views support the same conclusion.
3. Composition plot
Example output:
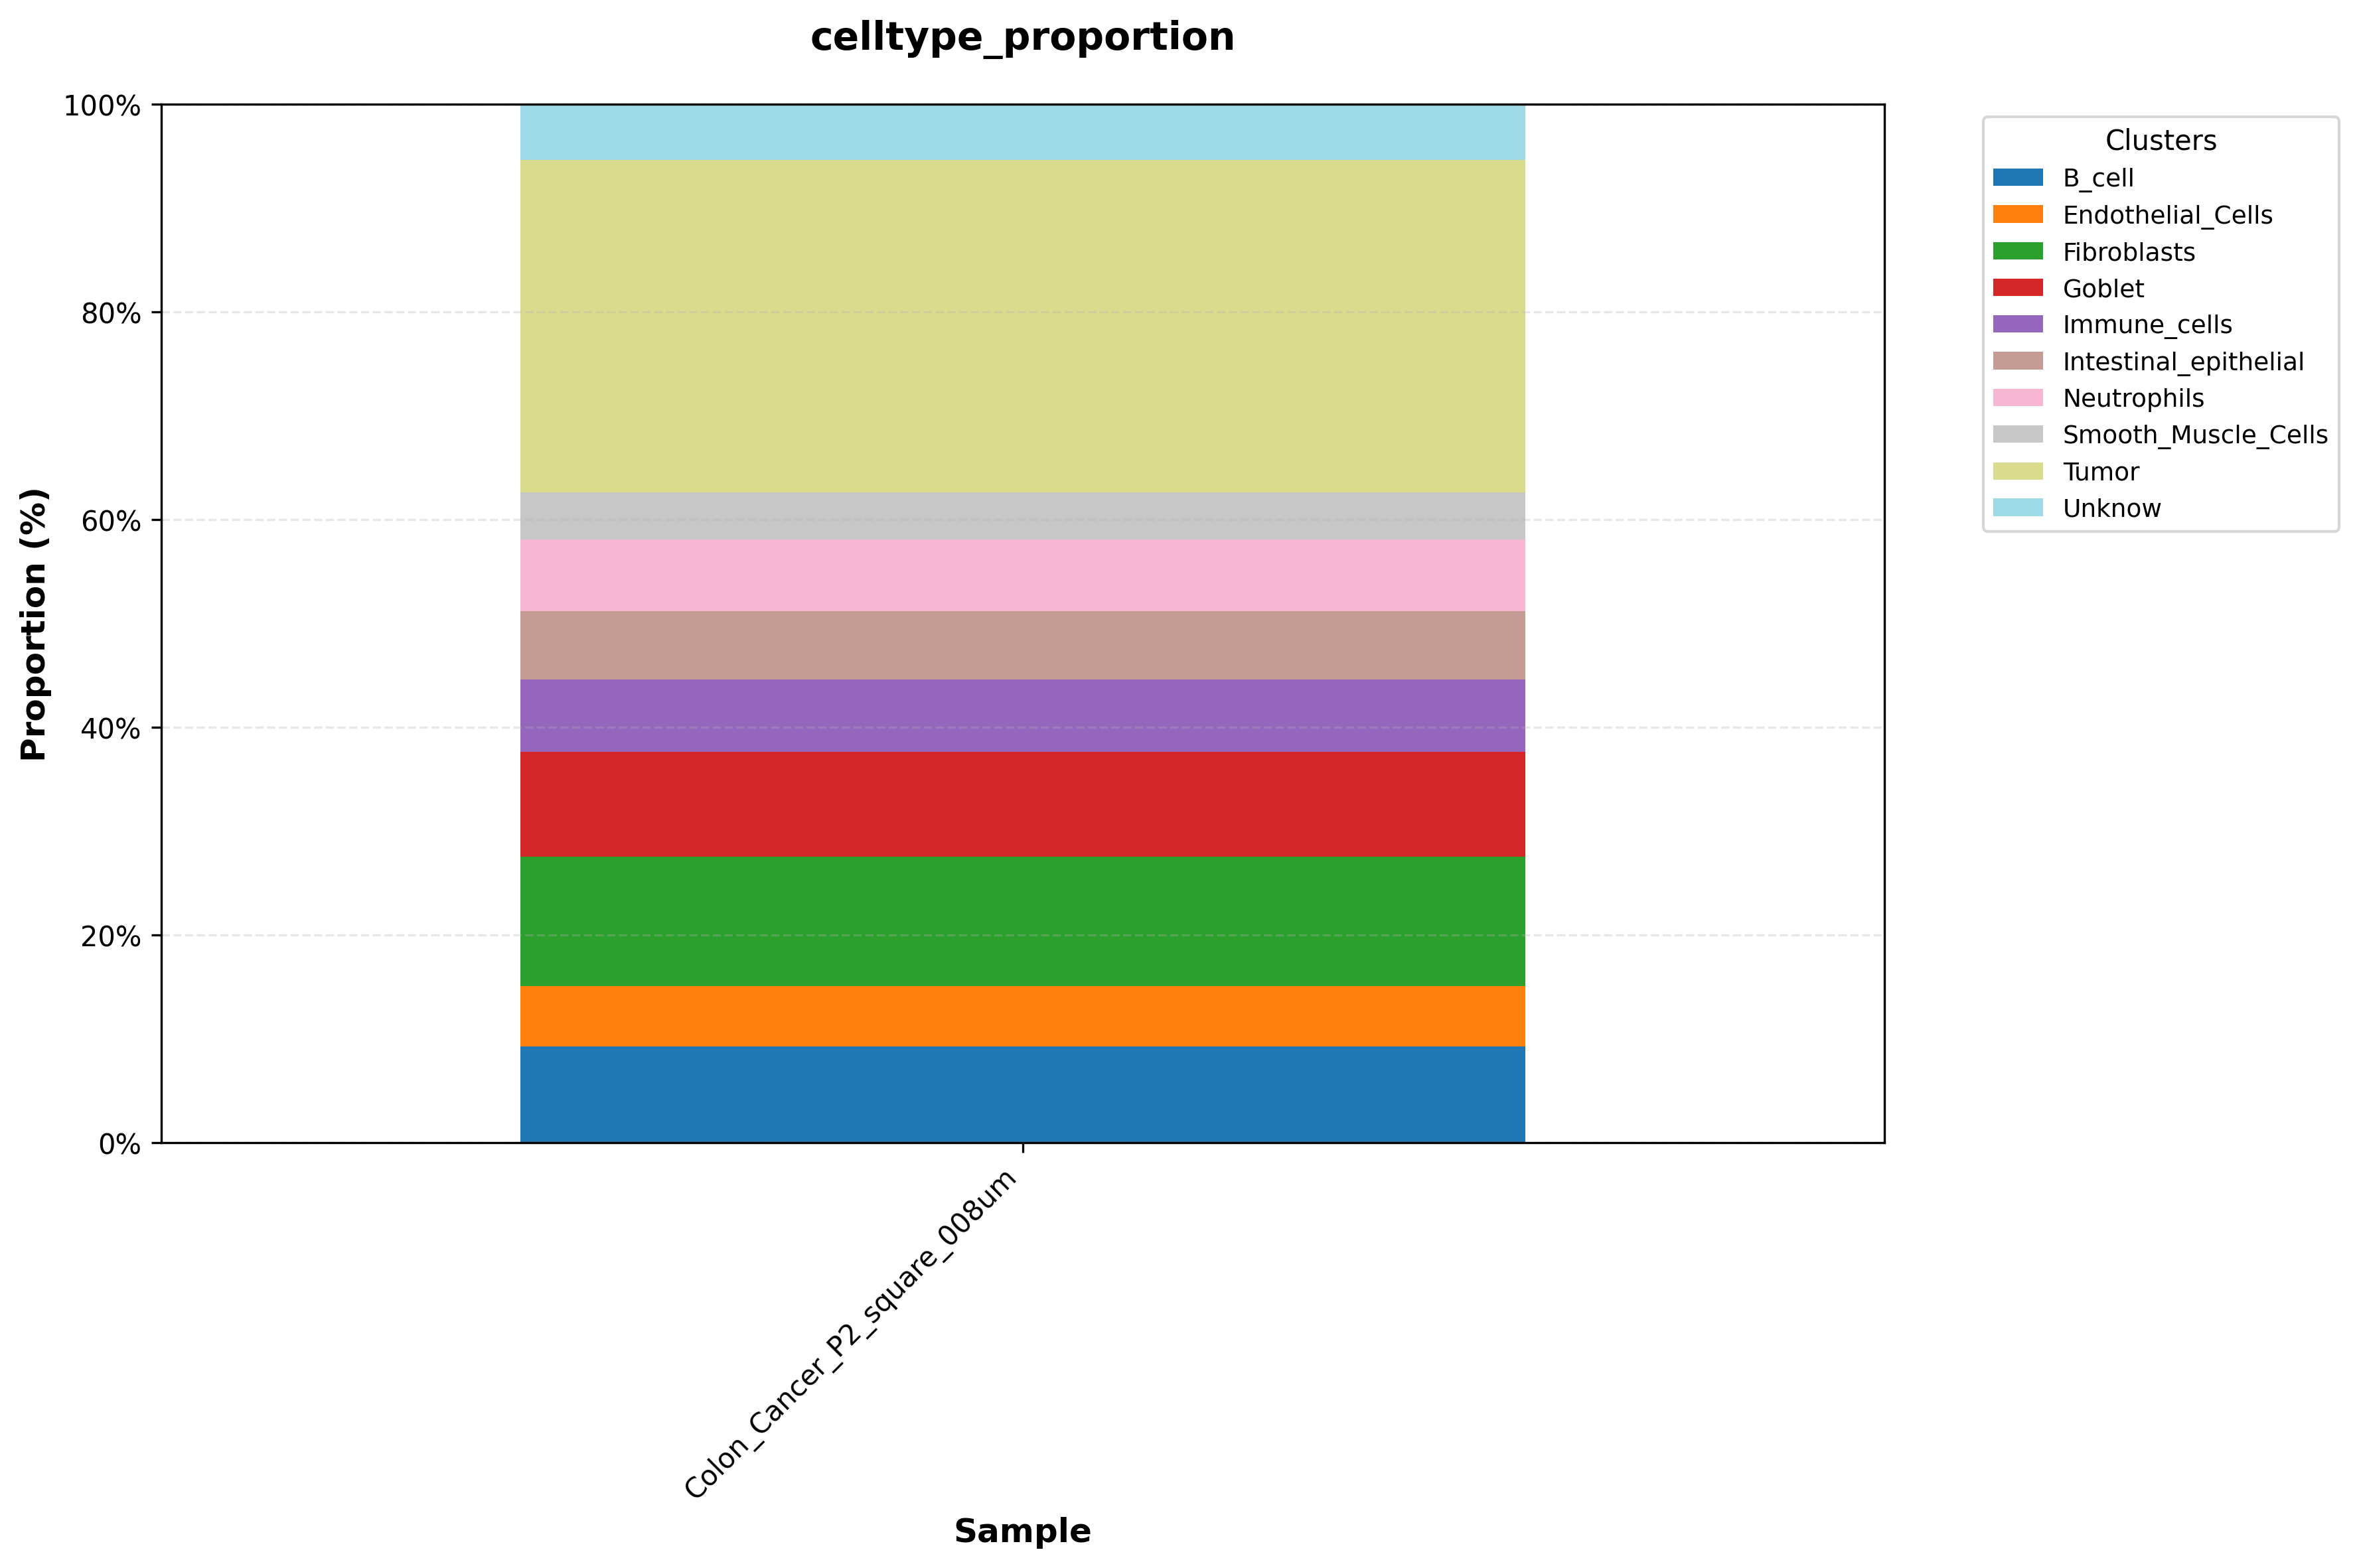
Celltype proportion plot used to compare cell type composition across regions or samples.
Interpretation: This plot compares the relative abundance of each cell type across regions or samples. If one cell type is highly enriched in only one area, interpret it in the context of tissue structure and sampling strategy before deciding whether it reflects biology or technical bias.
Suggestion: In multi-sample studies, first account for differences in sample size and sequencing depth before interpreting changes in composition.
Exported annotation table (
*_cell_clusters.csvor*_cell_groups.csv)
This file provides the direct mapping from barcode to annotation label and serves as a standard exchange format for downstream differential analysis, visualization platforms, and manual review.
The annotation shown here is performed at the major cell-type level. If you want to annotate finer subclusters, simply increasing resolution and pcs is usually not sufficient. Instead, split out the cell type of interest and run PCA and clustering again at that level, as described in Secondary Clustering (reclustering).