Module 1: Cell-Cell Communication (cellPhoneDB)
cellPhoneDB infers ligand-receptor communication between annotated cell types.
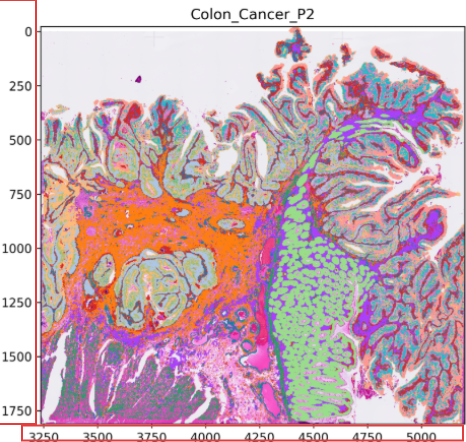
In this tutorial, we use the Colon_Cancer_P2 workflow results as an example. If you first need to isolate a specific subpopulation, see Splitting Tool (splitting).
To keep the demonstration concise, we use the four tumor subclusters obtained after reannotation and run the statistical cellPhoneDB workflow on that subset.
Workflow overview
Read the input object and extract
cell_idtogether with the selected cell-type annotation column to generate{sample}_cellid_cell_type.txt.Run cellPhoneDB in either
statisticalordegsmode, depending oncpdb_method.Export result tables such as means, p-values, deconvoluted interactions, and interaction scores.
Automatically generate a heatmap, dot plot, family-specific dot plot, and, when possible, a chord plot.
Scenario 1: Standard statistical mode (statistical)
This mode is suitable for routine exploratory analysis and can be run directly on annotated .zarr or .h5ad objects.
Configuration
sample.txt should contain at least the sample ID and input object path:
samples path_to_dir
Colon_Cancer_P2_008um results/Colon_Cancer_P2_008um/reannotation/Colon_Cancer_P2_008um.zarr
Recommended parameters are described in advance_analysis.yaml Reference.
cellPhoneDB_input: ""
cpdb_method: "statistical"
counts_data: "hgnc_symbol"
output_name: "Colon_Cancer_P2"
threshold: 0.1
threads: 16
pvalue: 0.05
iterations: 500
microenvs_file_path: ""
active_tf_path: ""
degs_file_path: ""
niche_col: "None"
is_singlecell: False
cpdb_de_method: "wilcoxon"
celltype_col: "celltype"
cell_type1: "Tumor_II"
cell_type2: "Tumor_I"
gene_family: ""
Run the workflow
spatialsnake single_analysis sample.txt visium --option=advance_analysis --runpipe=cellPhoneDB --threads 8 --output_name Colon_Cancer_P2
Result file structure
results/
└── {sample}/
    └── cellPhoneDB_results/
        ├── adata.h5ad
        ├── {sample}_cellid_cell_type.txt
        ├── {sample}_heatmap.png
        ├── {sample}_dot_plot.png
        ├── {sample}_dot_family_plot.png
        ├── {sample}_chord_plot.png                # generated only when the required inputs are available
        └── cellphonedb_output/
            ├── statistical_analysis_means_{output_name}.txt
            ├── statistical_analysis_pvalues_{output_name}.txt
            ├── statistical_analysis_deconvoluted_{output_name}.txt
            ├── statistical_analysis_interaction_scores_{output_name}.txt
            └── statistical_analysis_relevant_interactions_{output_name}.txt
Automatic plotting logic
If no annotation column is specified explicitly, the workflow searches common names in the following order:
celltype→cell_type→celltypes→cell_type_annotation.If
cell_type1orcell_type2is missing or invalid, the workflow automatically selects the two most abundant cell types for the default dot plot.If
gene_familyis missing or unsupported, the family-specific dot plot defaults tochemokines.The heatmap and dot plot require only the means and p-value tables.
The chord plot is generated only when both a valid interaction list and a deconvoluted file are available. If those conditions are not met, the workflow skips the chord plot without affecting the remaining outputs.
Scenario 2: Spatial microenvironment-constrained mode
This mode is appropriate when you want to restrict communication inference using spatial domain information.
Typical inputs include the spatial_cluster labels generated by BANKSY or CellCharter, or a manually prepared microenvs_file that follows the official cellPhoneDB format.
If you generated spatial domains within Spatialsnake, you can usually run this mode directly without writing microenvs_file manually.
Example:
cell_type    microenvironment
NKcells_1    location_1
NKcells_0    location_2
Tcells       location_1
Myeloid      location_2
Configuration
First generate the template:
spatialsnake produce-file --option=advance_analysis
Then edit advance_analysis.yaml as follows:
cellPhoneDB_input: ""
counts_data: "hgnc_symbol"
threshold: 0.1
threads: 16
pvalue: 0.05
output_name: "Colon_Cancer_P2"
iterations: 500
microenvs_file_path: "" # provide this only if you want to use a manually prepared file
active_tf_path: ""
degs_file_path: ""
niche_col: "spatial_cluster"    # spatial domain column; the default Spatialsnake output uses spatial_cluster
is_singlecell: False            # use False for spatial transcriptomics data
cpdb_method: "statistical"
cpdb_de_method: "wilcoxon"
celltype_col: "celltype"
cell_type1: "Tumor_II"
cell_type2: "Tumor_I"
gene_family: ""
Note
If
microenvs_file_pathis empty, the workflow automatically generates{sample}_microenvs.txtfromcelltype_colandniche_col.For spatial data, if both
microenvs_file_pathand a validniche_colare missing, the workflow stops with an error rather than running an unconstrained analysis unintentionally.
Run the workflow
spatialsnake single_analysis sample.txt visium_HD --option=advance_analysis --runpipe=cellPhoneDB --configfile advance_analysis.yaml
Result file structure
results/
└── {sample}/
    └── cellPhoneDB_results/
        ├── adata.h5ad
        ├── {sample}_cellid_cell_type.txt
        ├── {sample}_microenvs.txt
        ├── {sample}_heatmap.png
        ├── {sample}_dot_plot.png
        ├── {sample}_dot_family_plot.png
        ├── {sample}_chord_plot.png                # generated only when the required inputs are available
        └── cellphonedb_output/
            └── statistical_analysis_*_{output_name}.txt
Scenario 3: DEG/TF-constrained mode (degs + active TF)
This mode is useful when you already have a DEG list and want to introduce prior biological constraints into the ligand-receptor search, often resulting in a more focused interpretation.
Example DEG.txt:
cluster    gene    deg
Myeloid    ENSG00000188157    1
NKcells_0    ENSG00000230368    1
NKcells_0    ENSG00000186350    1
NKcells_0    ENSG00000134250    1
Tcells    ENSG00000188976    1
Example TFs.txt:
cluster    TF
NKcells_0    ID4
Configuration
Set the following fields in advance_analysis.yaml:
cellPhoneDB_input: "path/to/input.zarr"
cpdb_method: "degs"
degs_file_path: "path/to/DEG_list.txt"
active_tf_path: "path/to/tf_activity.txt"
Notes:
When
cpdb_method=degs,degs_file_pathis required. The workflow stops if the file does not exist.active_tf_pathis used only when the file is present. Invalid paths are ignored automatically and do not stop the run.To ensure that downstream visualization reads the expected
degs_analysis_*outputs, use an existing and verifieddegs_file_path.
Run the workflow
spatialsnake single_analysis sample.txt visium_HD --option=advance_analysis --runpipe=cellPhoneDB --configfile advance_analysis.yaml
Result file structure
results/
└── {sample}/
    └── cellPhoneDB_results/
        ├── {sample}_heatmap.png
        ├── {sample}_dot_plot.png
        ├── {sample}_dot_family_plot.png
        ├── {sample}_chord_plot.png                # generated only when the required inputs are available
        └── cellphonedb_output/
            ├── degs_analysis_means_{output_name}.txt
            ├── degs_analysis_pvalues_{output_name}.txt
            ├── degs_analysis_deconvoluted_{output_name}.txt
            └── degs_analysis_relevant_interactions_{output_name}.txt
Interpreting the output
Below we use the outputs from Scenario 1 to illustrate the four main figure types produced in cellPhoneDB_results.
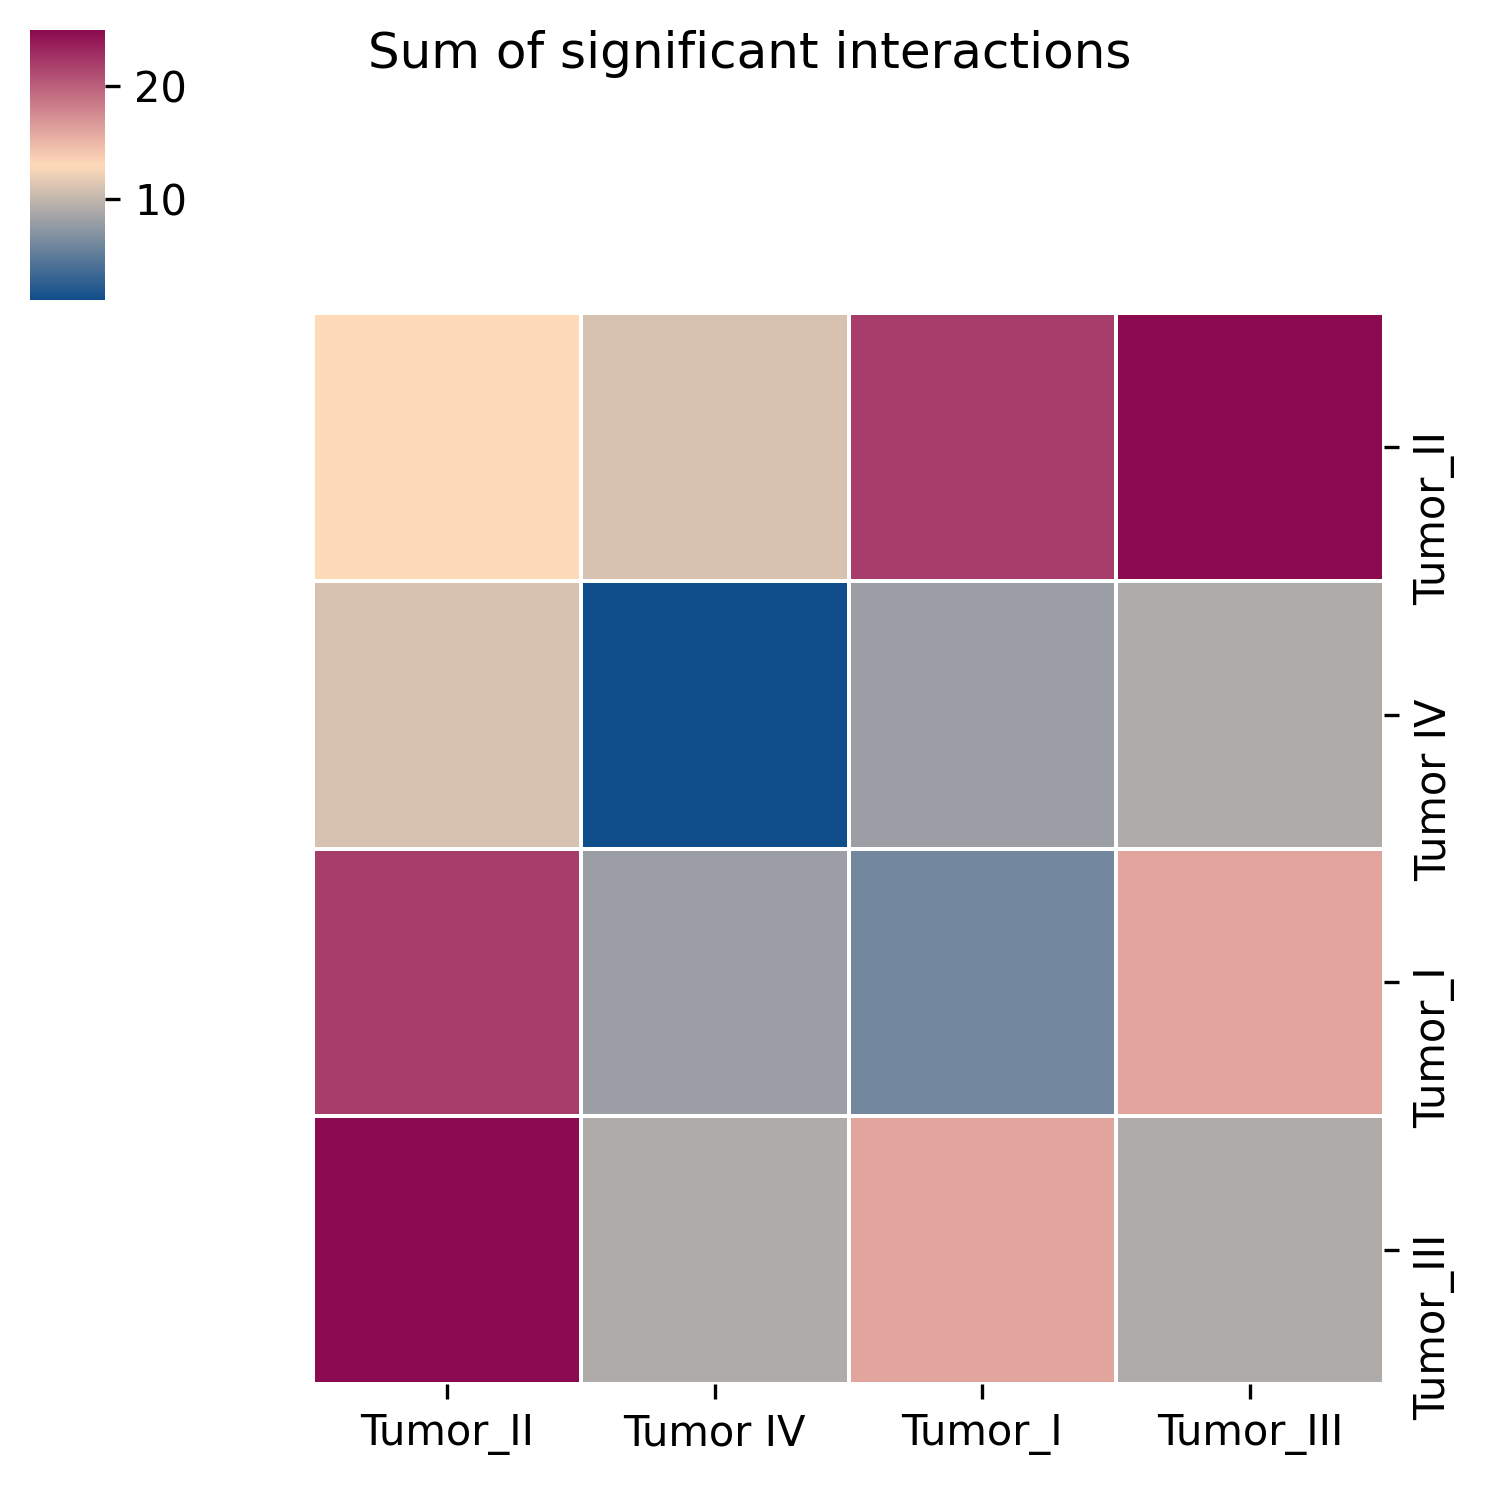
Interpretation: The heatmap provides an overview of the number of significant interactions between every pair of cell types and is useful for identifying the most communication-active cell pairs.
Suggestion: Use the heatmap to identify the strongest candidate cell pairs first, then inspect the dot plot to examine specific ligand-receptor interactions in detail.
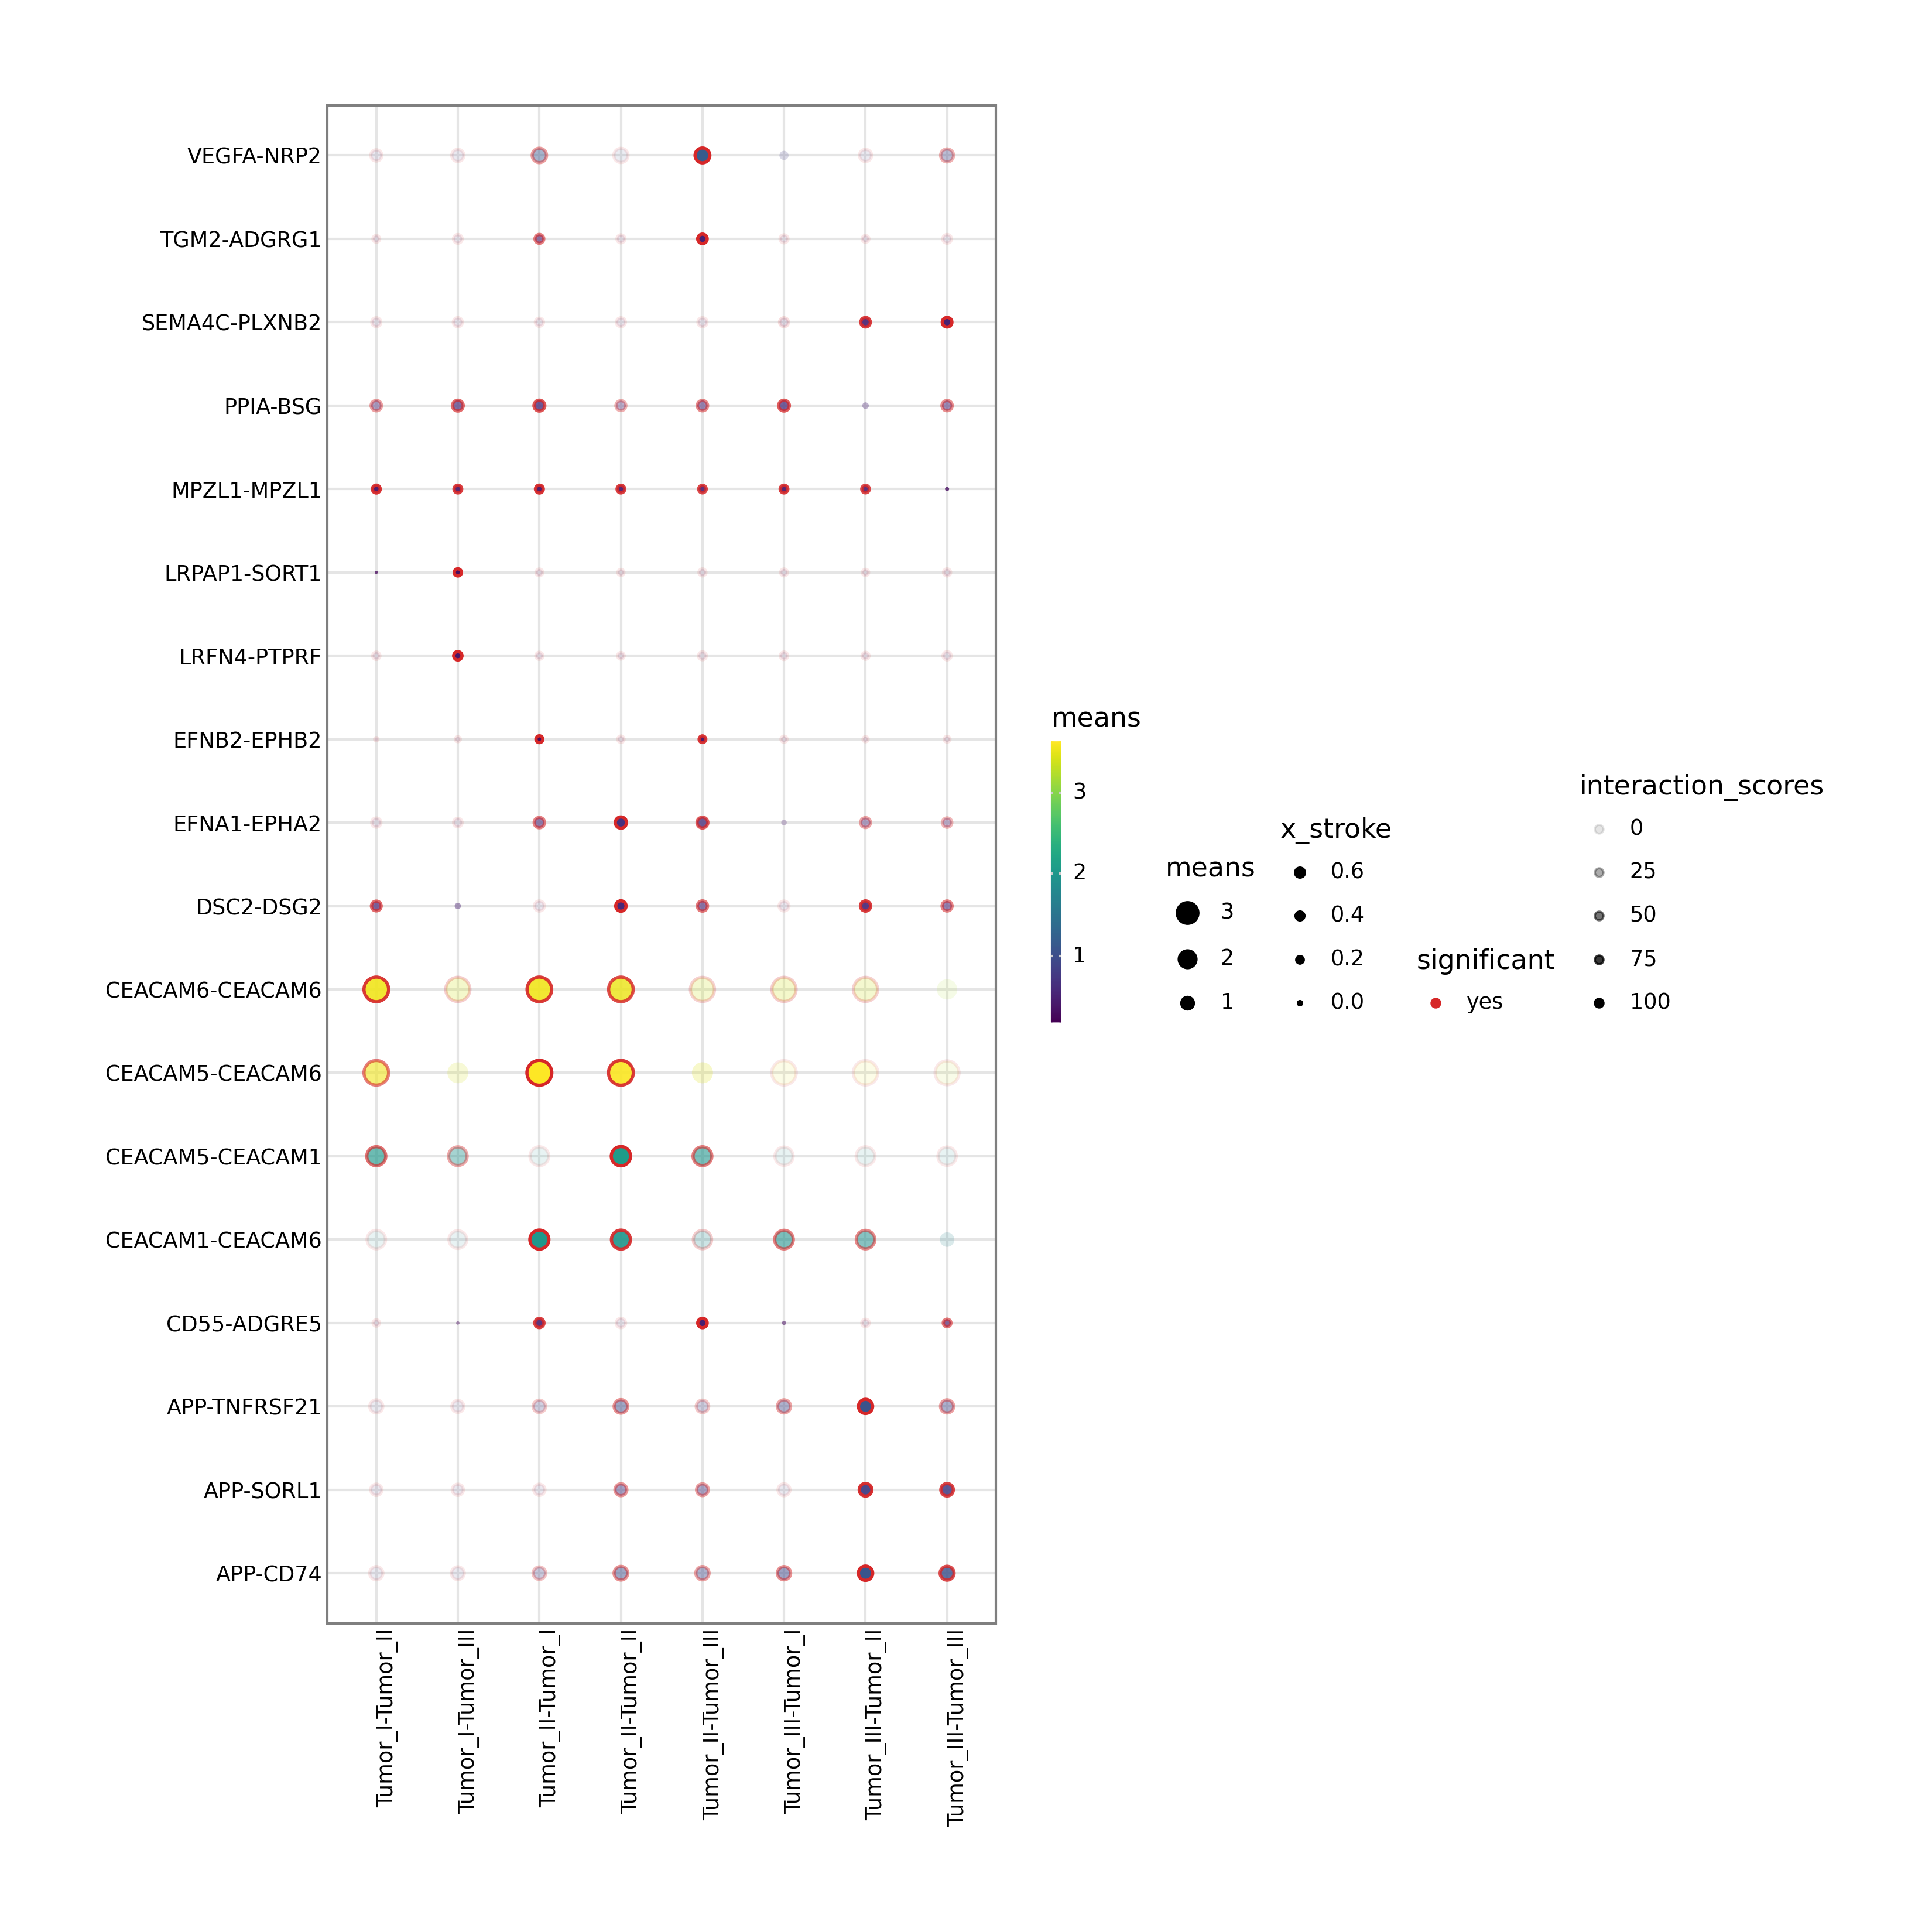
Interpretation:
The dot plot shows ligand-receptor interactions between the selected cell_type1 and cell_type2. Dot size and color encode interaction strength and significance.
Automatic fallback logic:
If
cell_type1orcell_type2is missing or invalid, the workflow selects the two most abundant cell types automatically.If no annotation column is specified, the workflow searches a list of common cell-type column names and uses the first valid match.
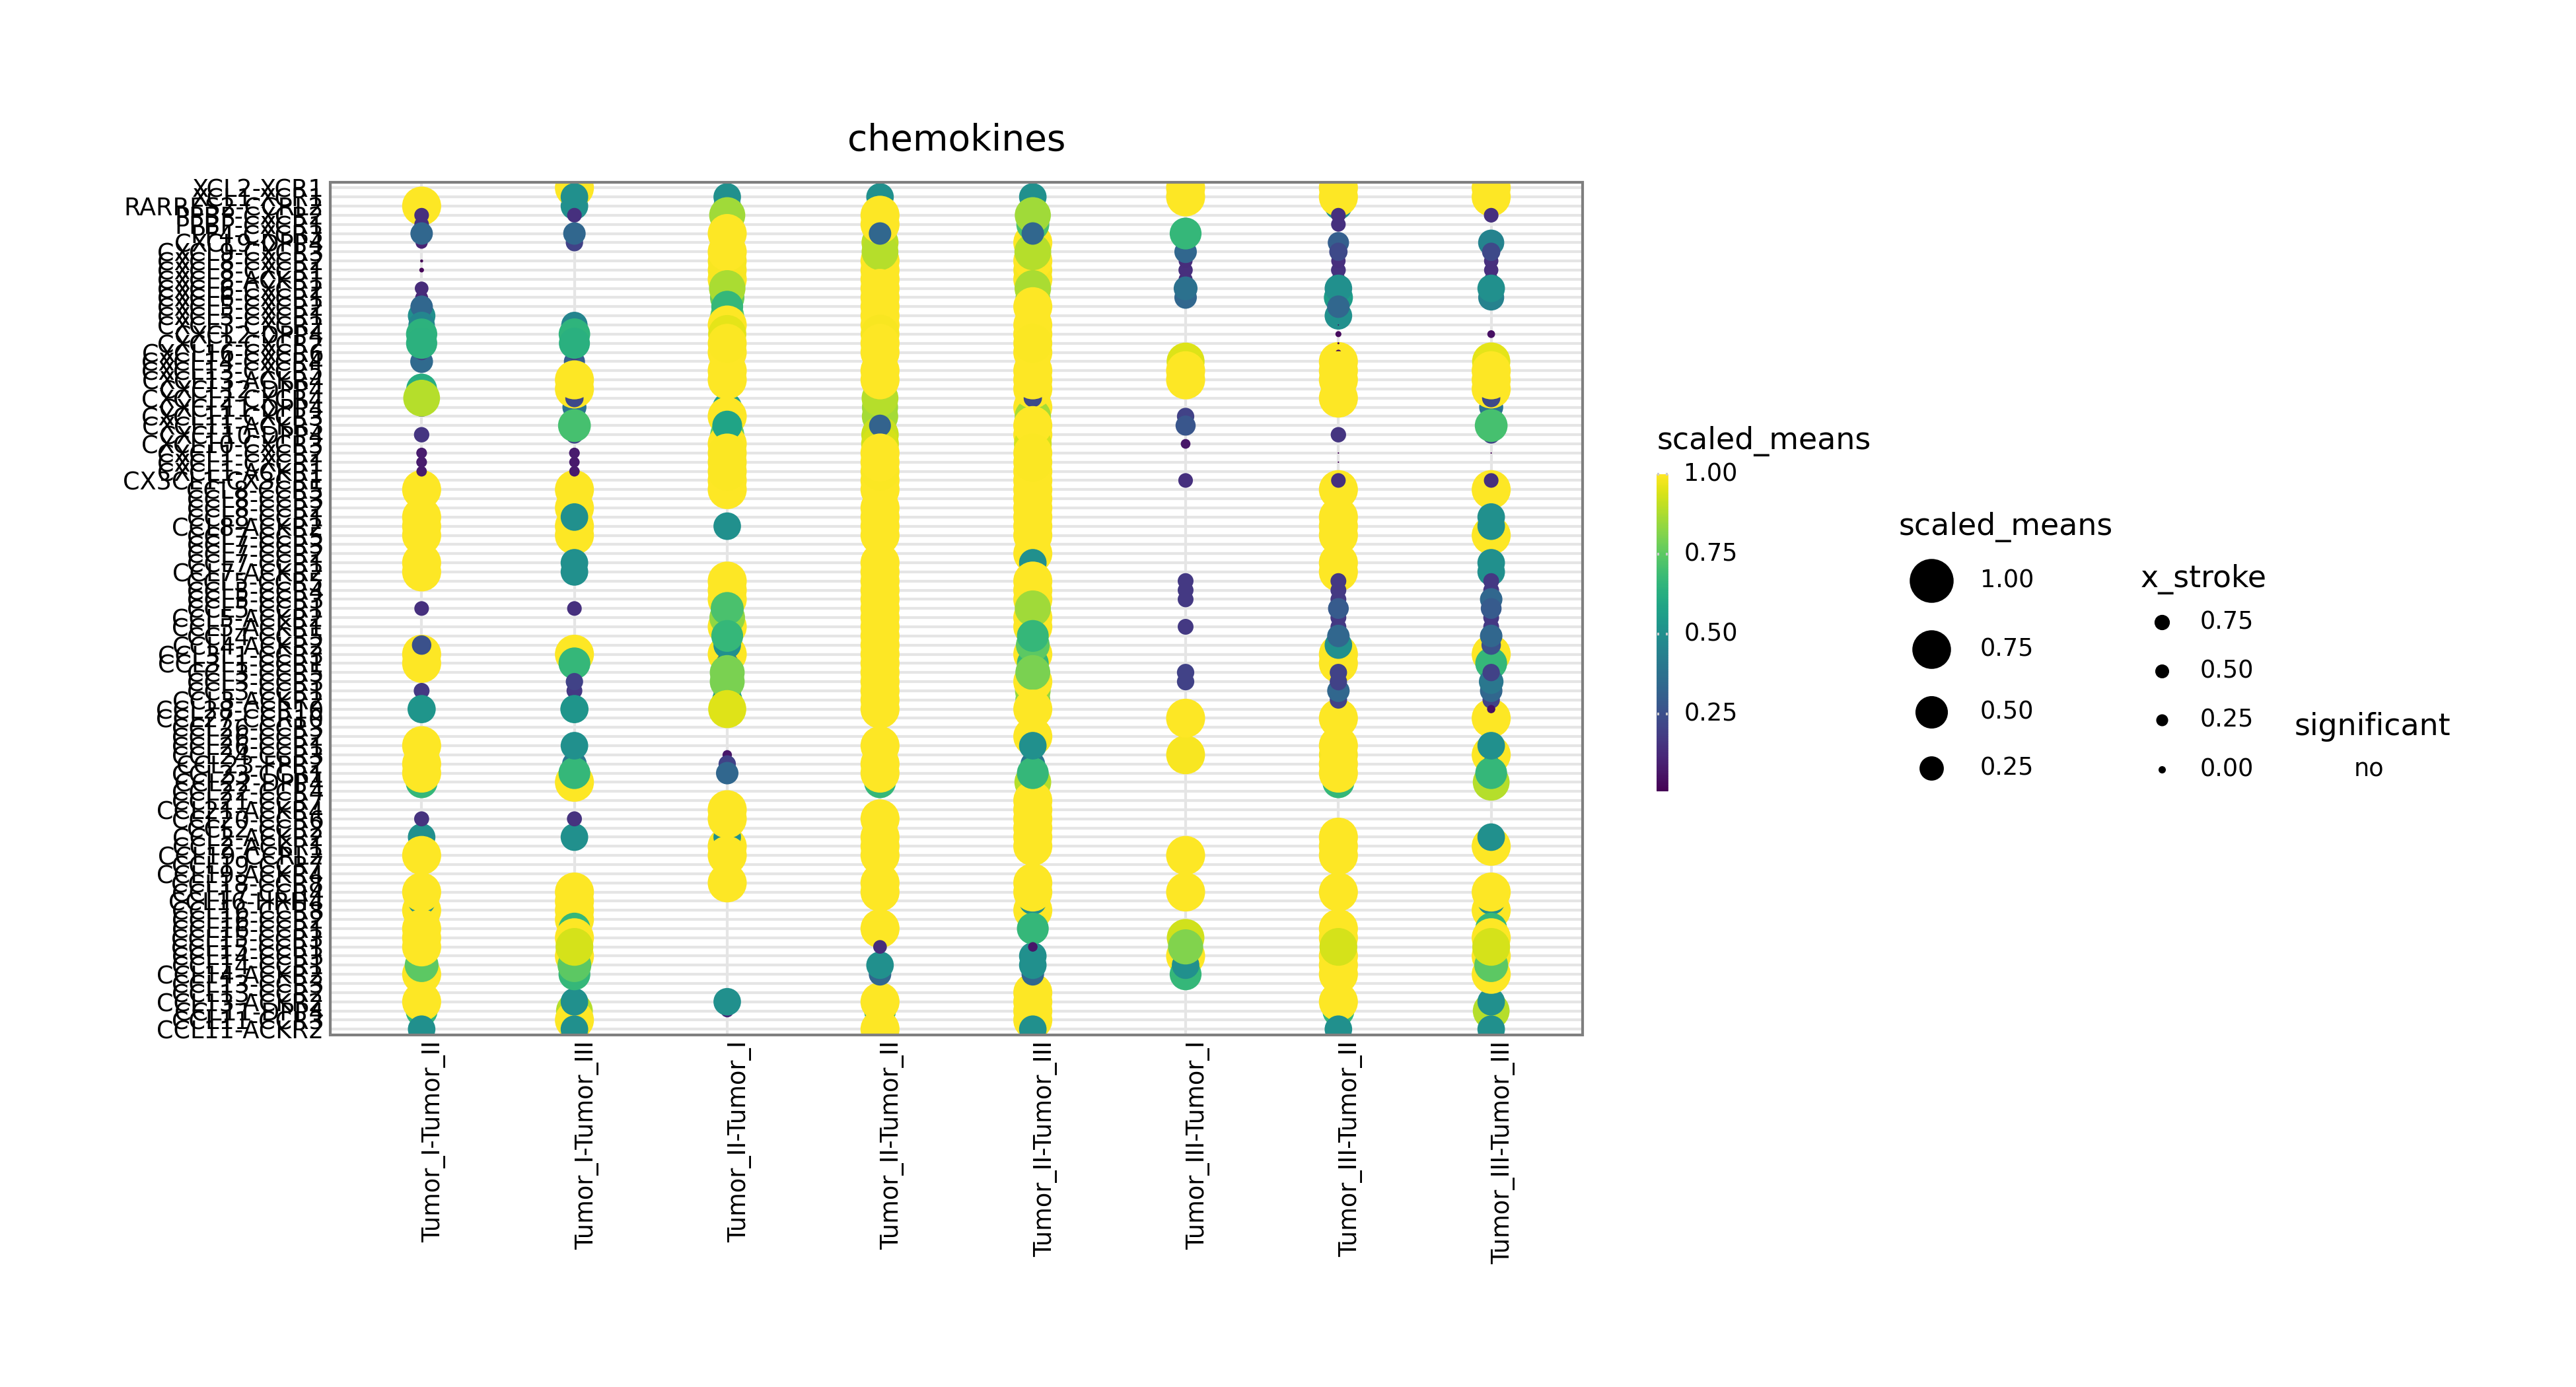
Interpretation:
This figure focuses on one signaling family, such as chemokines, th1, or th2, and is useful for mechanism-oriented follow-up analysis.
Automatic fallback logic:
If gene_family is missing or unsupported, the workflow defaults to chemokines.
The built-in visualization covers the most common summary figures. For more customized presentation, you can continue with the official cellPhoneDB ecosystem, for example by using cellphonedbviz.
CellphoneDB v5: inferring cell-cell communication from single-cell multiomics data. Troule et al. Nat Protocols 2025