Module 2: Regulatory Network Inference (pysenic)
pysenic infers transcription factor regulatory networks (regulons) from the expression matrix and calculates regulon activity for each cell or spot using AUCell.
In addition to the standard heatmap-style outputs, Spatialsnake generates dot plots, violin plots, and activity tables to make the results easier to interpret and reproduce.
Because pySCENIC is computationally intensive, we use a previously prepared subset of Colon_Cancer_P1 for demonstration. If you want to analyze another cell population of interest, first create a subset as described in Splitting Tool (splitting).
To reduce runtime and memory usage, it is often practical to begin with relatively small subsets.
For example, the combined Smooth_Muscle_Cells and Endothelial_Cells subset contains 44,396 cells and 15,450 genes, and required roughly 4 hours with 64 CPU cores in our test setting. Please make sure that your available memory is sufficient.
spatialsnake useful_tool --option=splitting results/Colon_Cancer_P2_008um/annotation/Colon_Cancer_P2.zarr --split_by celltype --barcodes Smooth_Muscle_Cells,Endothelial_Cells
For the configuration reference, see advance_analysis.yaml Reference.
Workflow overview
Read the input object and convert formats Load the spatial transcriptomics object (
.zarror.h5ad) and convert it to the.loomformat required by pySCENIC.Infer the co-expression network with GRNBoost2 Use GRNBoost2 to infer candidate transcription factor-target co-expression relationships from the expression matrix.
Filter candidate modules by motif enrichment with CisTarget Evaluate the candidate target sets against TF-motif databases, remove unsupported interactions, and define high-confidence regulons.
Score regulon activity with AUCell Calculate an AUC activity score for each regulon in each cell or spot.
Generate summary metrics and figures Write the AUC matrix back into the object, compute Regulon Specificity Scores (RSS), derive Z-score summaries by cell type, and generate heatmaps, dot plots, and violin plots.
Prepare the input files
Recommended sample.txt format:
sample_id   input_path
Colon_Cancer_P2_008um results/useful_tool/celltype_selected_Smooth_Muscle_Cells_Endothelial_Cells.zarr
Key input requirements:
input_pathmust contain a valid expression matrix. Keeping acelltypecolumn in the object is strongly recommended for downstream interpretation.Before running pySCENIC, prepare three classes of official resources:
tfs_input(TF list),feather_input(cisTarget rankings database), andmotifs_input(motif-to-TF annotation table).All three resources must use the same species and compatible versioning, preferably v10, to avoid mismatches that can drastically reduce the number of recovered regulons.
Official resource links (human and mouse)
tfs_input(TF list)Human (hg38): allTFs_hg38.txt
Mouse (mm): allTFs_mm.txt
motifs_input(motif-to-TF annotation table, v10 recommended)Human (HGNC): motifs-v10nr_clust-nr.hgnc-m0.001-o0.0.tbl
Mouse (MGI): motifs-v10nr_clust-nr.mgi-m0.001-o0.0.tbl
feather_input(cisTarget rankings databases; two gene-based rankings are recommended)
Optional configuration
First generate the template:
spatialsnake produce-file --option=advance_analysis
senic_input: ""    # provided through sample.txt
sample_type: "Colon_Cancer_P2" # sample name
tfs_input: "data/hs_hgnc_tfs.txt"
feather_input: "data/hg38_10kbp_up_10kbp_down_full_tx_v10_clust.genes_vs_motifs.rankings.feather"
motifs_input: "data/motifs-v10nr_clust-nr.hgnc-m0.001-o0.0.tbl"
senic_workers: 64 # adjust according to the available CPU cores
gene_attr: "var_names"  # this works for data prepared with the Spatialsnake tutorial workflow
cell_attr: "cell_id"    # change only if your object uses another cell ID column
In our GitHub repository, you can find the necessary resource files in the resource directory. We provide human and mouse resource files to save you download time.
Run the command
spatialsnake single_analysis sample.txt visium --option=advance_analysis --runpipe=pysenic --configfile advance_analysis.yaml
Result file structure
The main outputs are written to results/pysenic_results/:
results/
└── pysenic_results/
    ├── {sample}.loom
    ├── {sample}.grn.tsv
    ├── {sample}.regulons.csv
    ├── {sample}.aucell.loom
    ├── {sample}.auc.csv
    ├── {sample}_regulon_genes.csv
    ├── {sample}_auc_mean_by_celltype.csv
    ├── {sample}_rss.csv
    ├── {sample}_rss_top10.csv
    ├── {sample}_dotplot_regulons.png
    ├── {sample}_violin_regulons.png
    ├── {sample}_auc_heatmap.png
    ├── {sample}_rss.png
    ├── {sample}_zscore_matrix.csv
    ├── {sample}_zscore_heatmap.png
    └── {sample}_stacked_violin.png
How to interpret the results
1. Regulon activity heatmaps
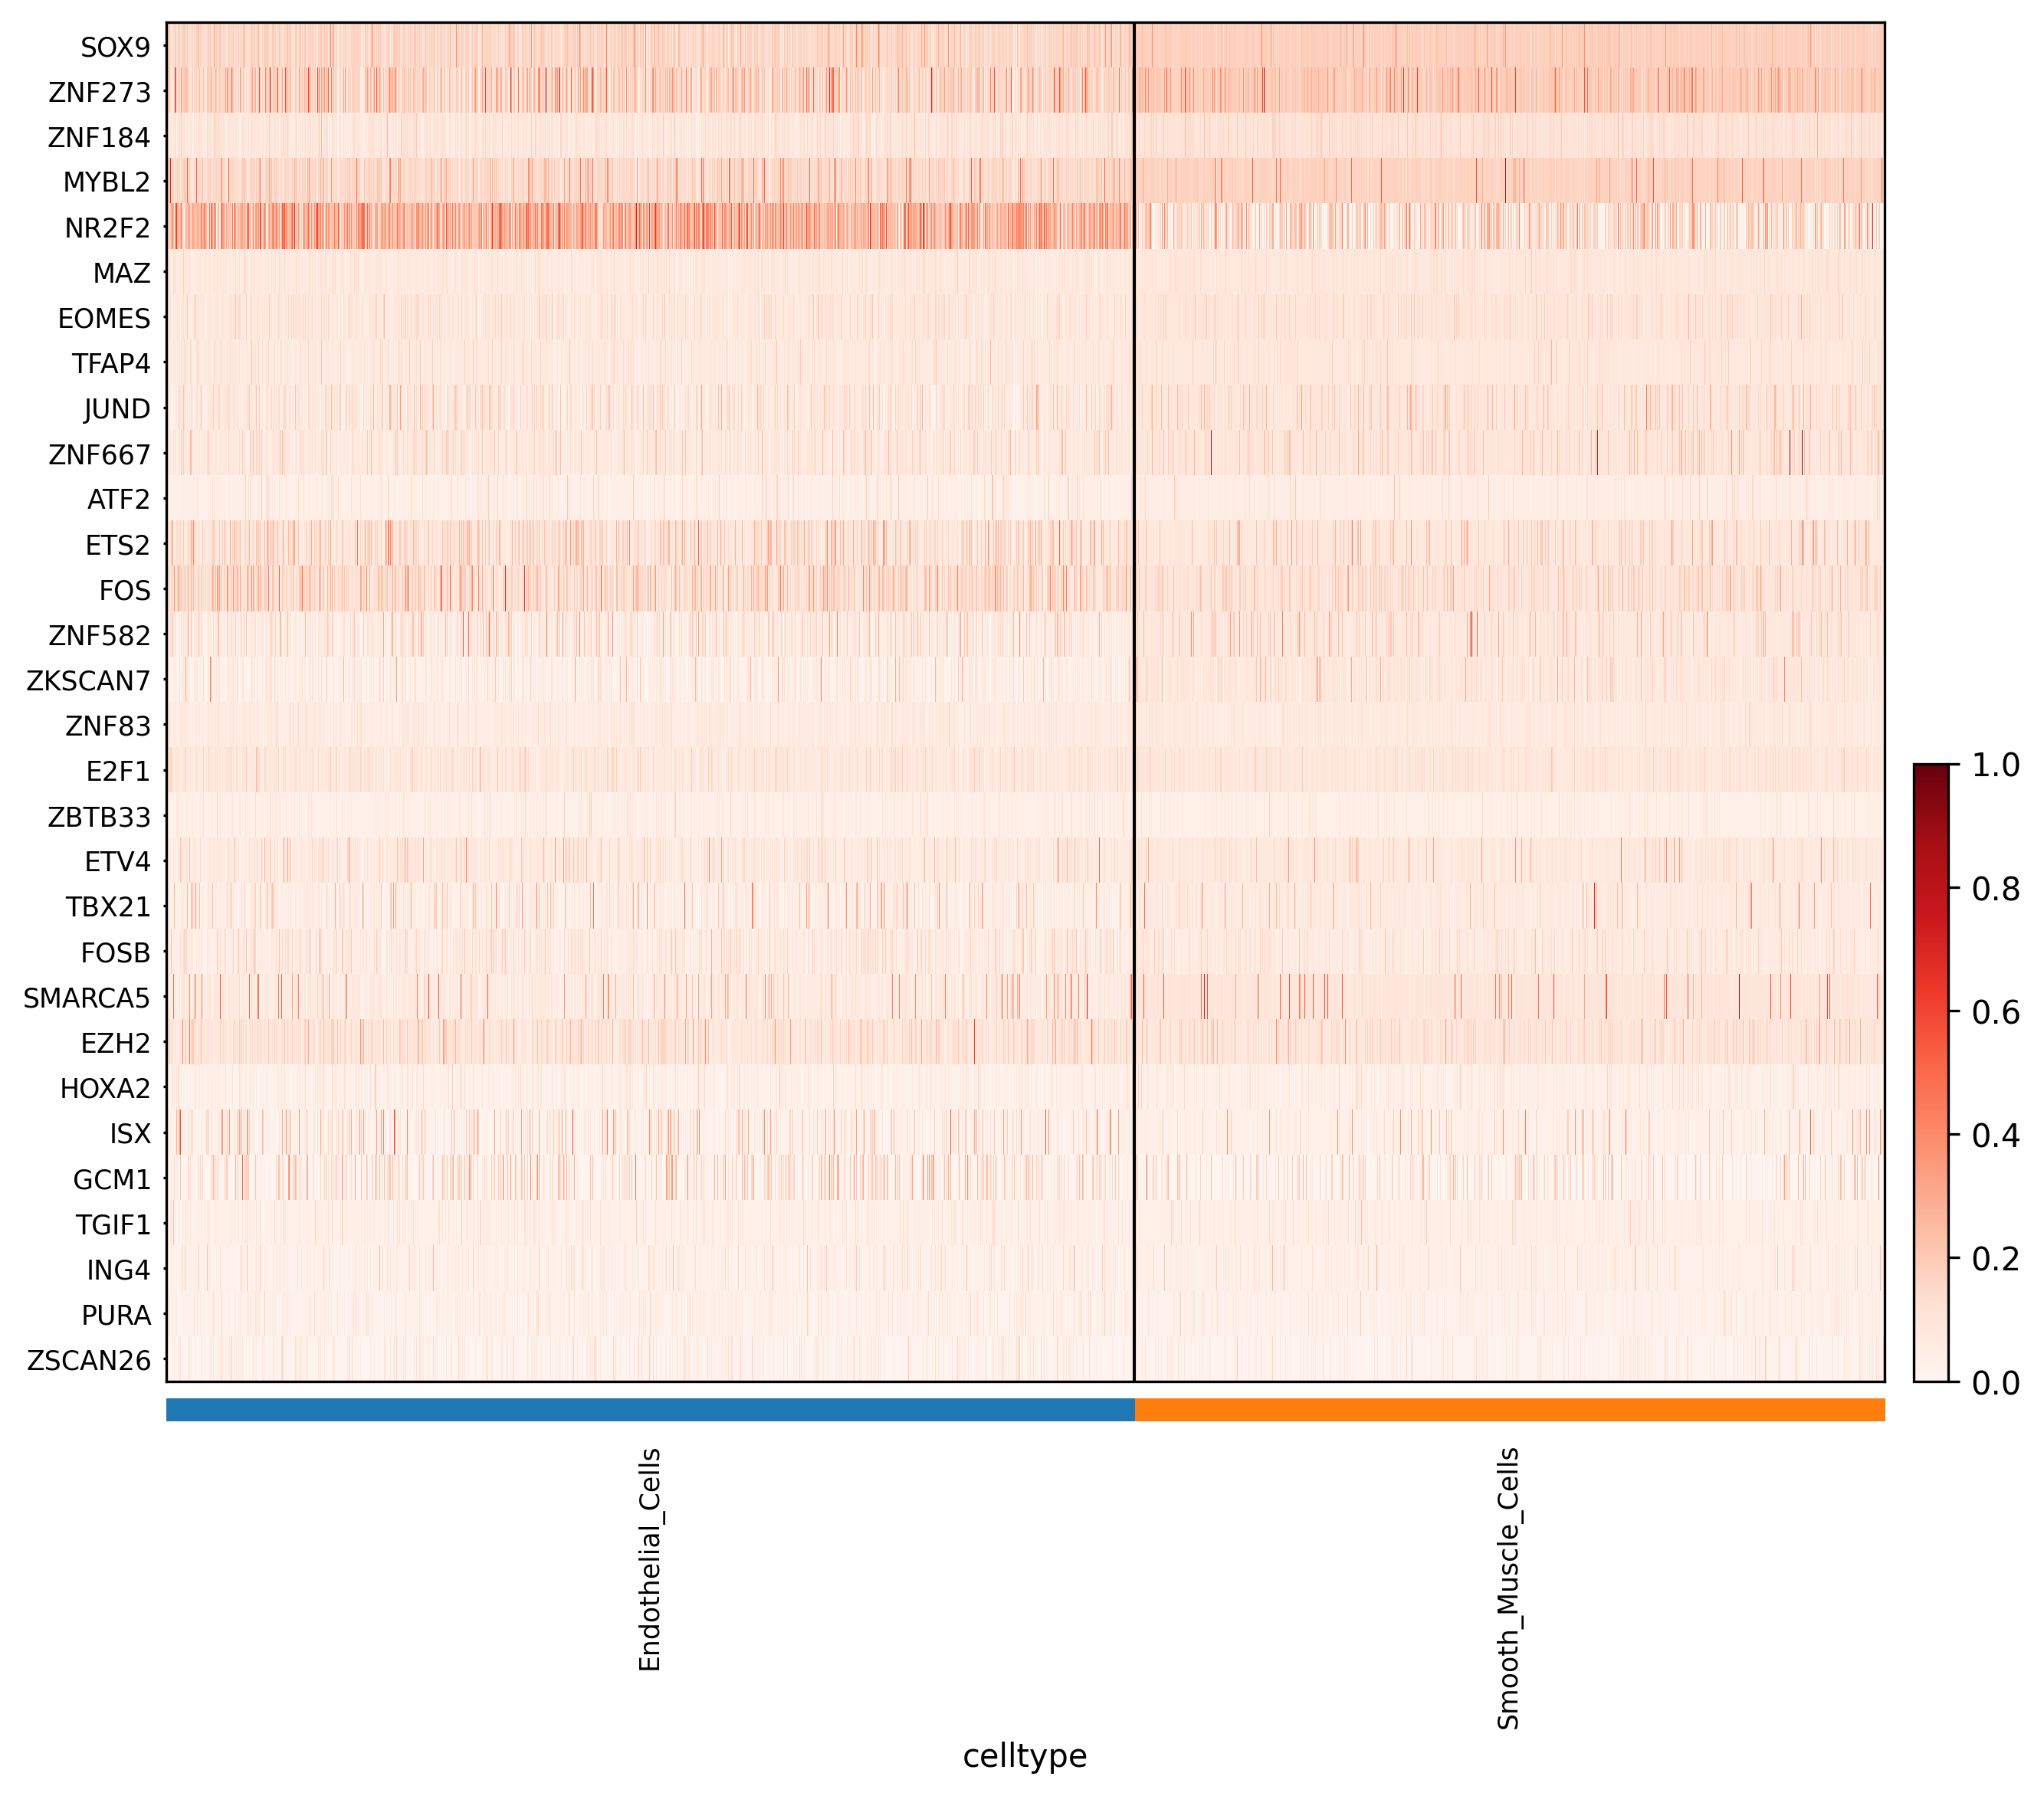
Interpretation:
*_auc_heatmap.png displays the major regulon activity patterns based on the AUC matrix.
*_zscore_heatmap.png is generated from the Z-score matrix calculated on cell-type means and is often more useful for identifying relatively cell-type-specific regulatory programs.
2. Regulon activity dot plot
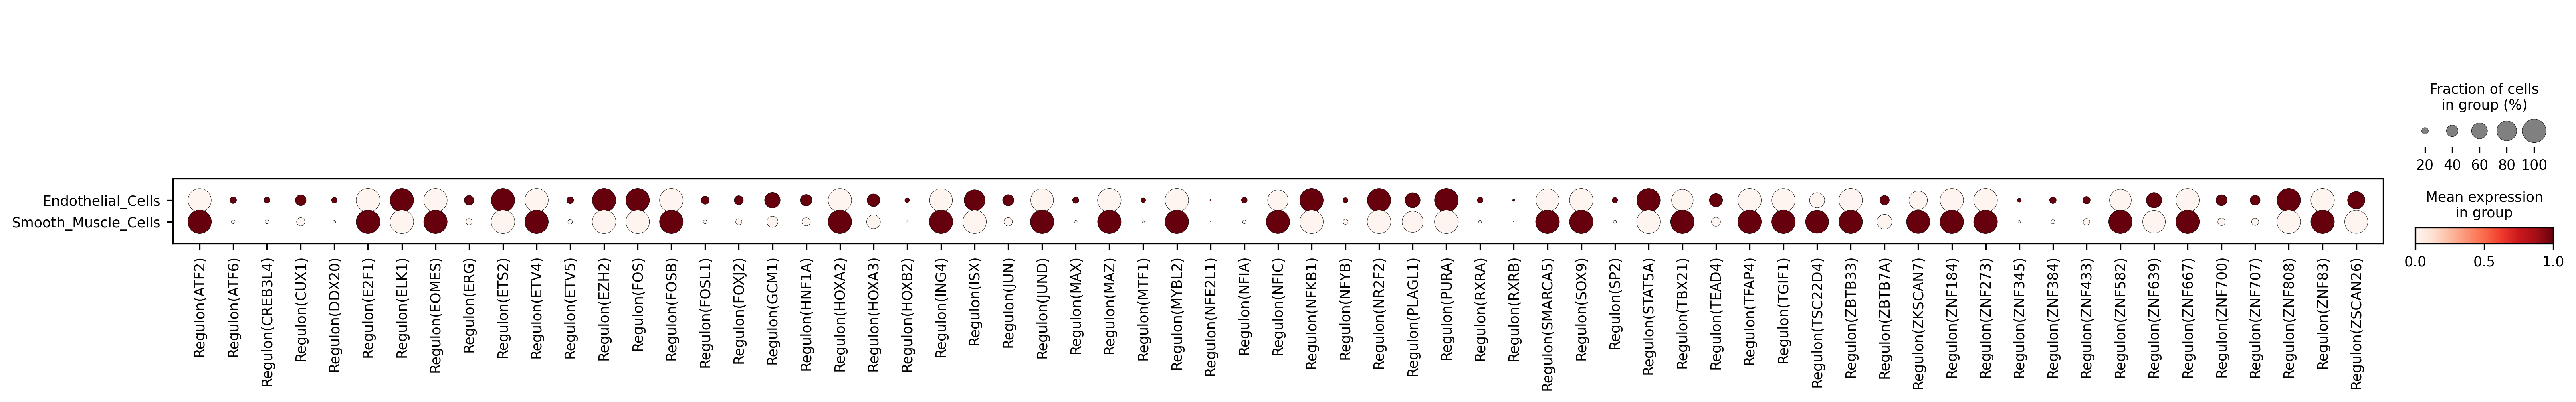
Interpretation: Dot size represents the mean regulon activity within each cell group, while color intensity reflects the relative activity level. This figure is especially useful for rapidly comparing the dominant regulatory programs across cell types.
3. Activity distribution violin plots

Interpretation:
*_violin_regulons.png shows the distributions of the top 12 regulons, whereas *_stacked_violin.png shows the top 20 regulons ranked by activity. These plots help you assess intra-group variability, skewness, and heterogeneity.
4. Cell-type specificity plot
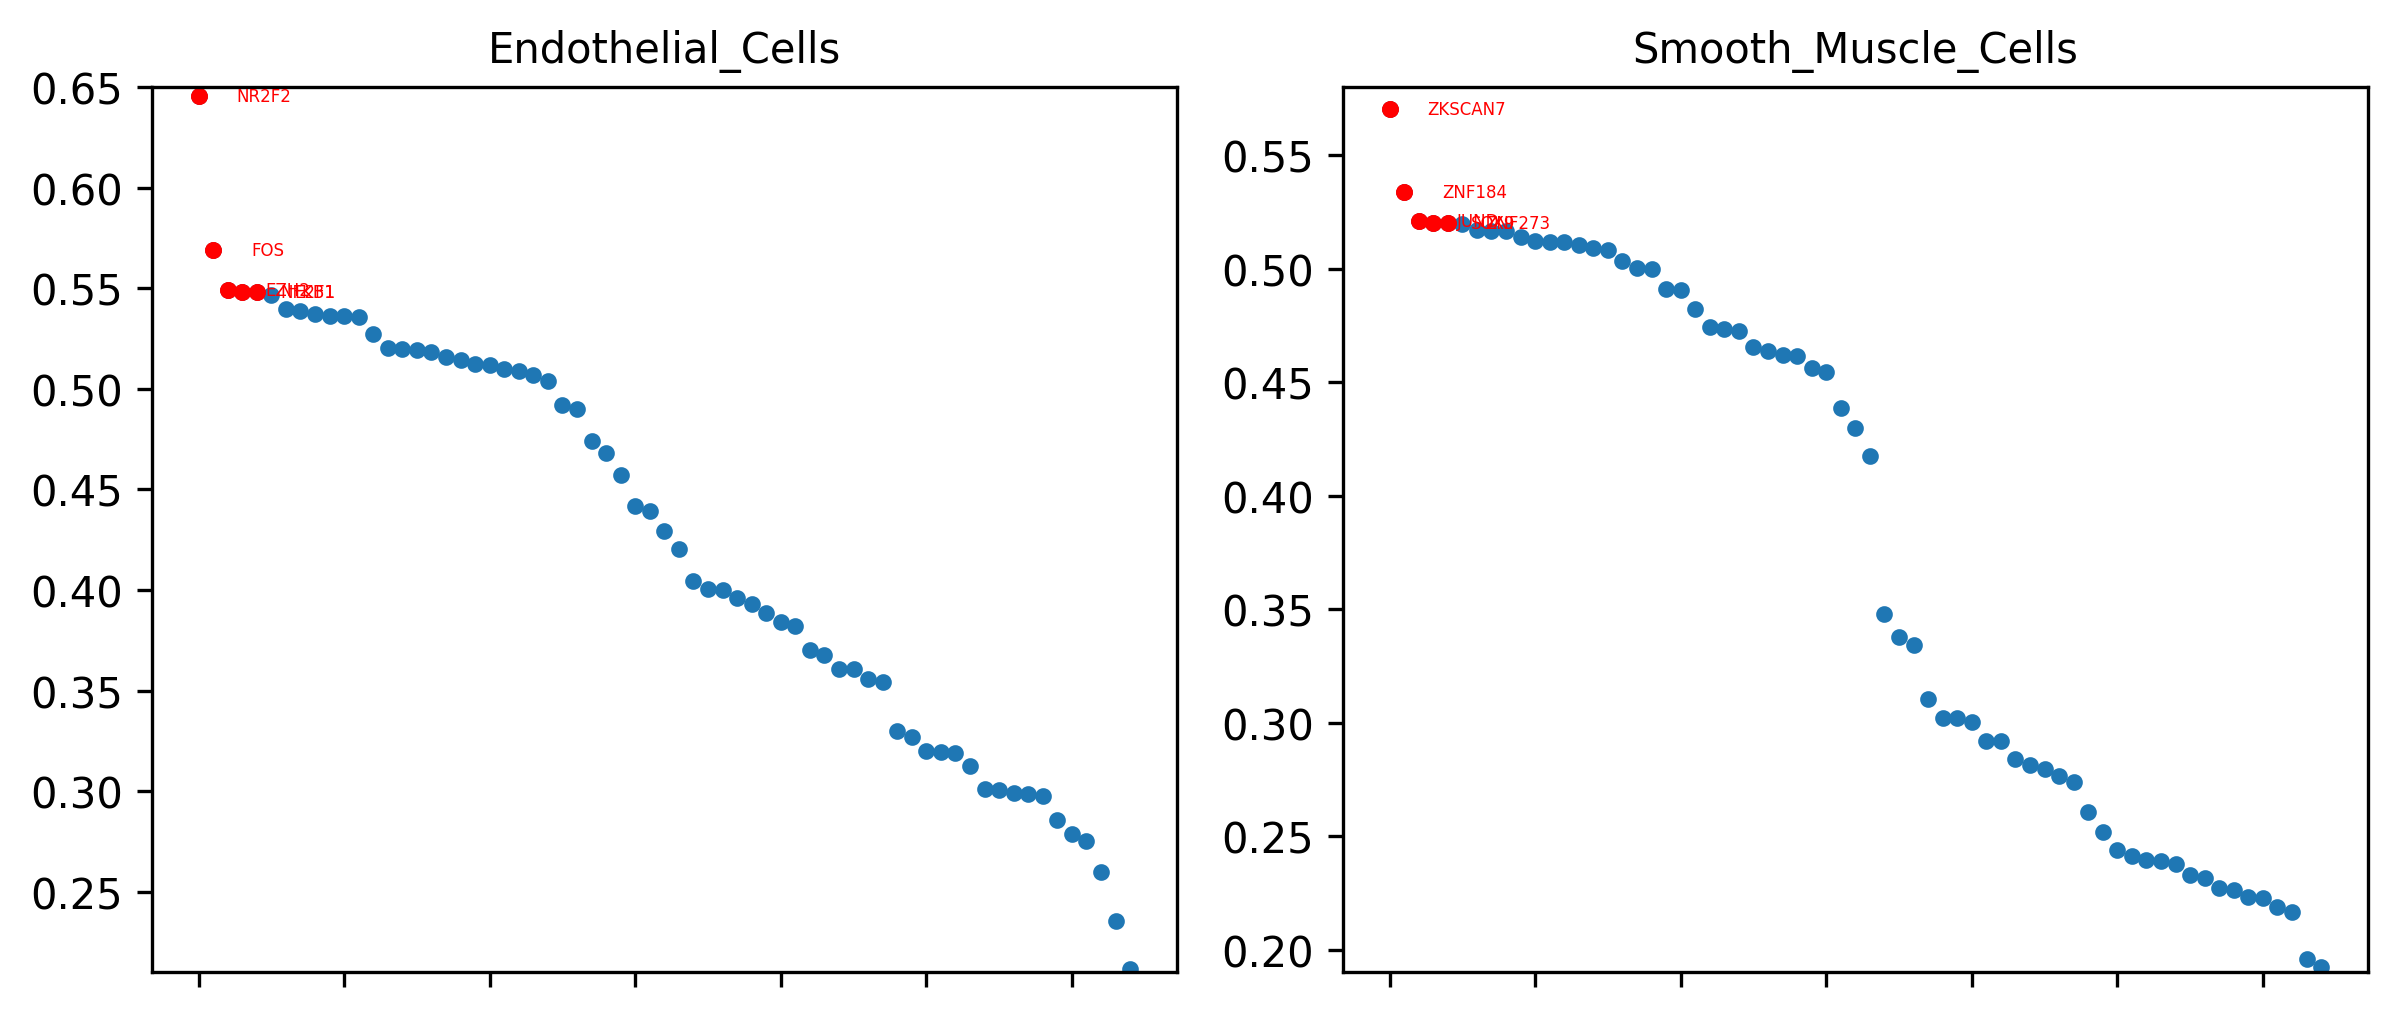
Interpretation: This plot is based on the Regulon Specificity Score (RSS). For each cell type, it highlights the most specific regulons and is therefore useful for defining cell states and prioritizing candidate master regulators.
5. Core result tables
Interpretation:
*.auc.csv is the raw regulon activity matrix at single-cell or single-spot resolution.
*_auc_mean_by_celltype.csv stores cell-type-level mean activity values.
*_zscore_matrix.csv stores the standardized matrix that is typically used together with the Z-score heatmap to identify specific regulatory axes.
6. Specificity and network detail tables
Interpretation:
*_rss.csv records regulon specificity scores for all cell types.
*_rss_top10.csv summarizes the top 10 regulons for each cell type.
*_regulon_genes.csv contains regulon-target gene relationships and is one of the most important tables for mechanistic interpretation and downstream experimental validation.