Module 8: Comparative Communication Analysis (compare_stage + cellchat)
To support comparative spatial transcriptomics analysis, Spatialsnake includes a compare_stage branch for CellChat outputs.
This module compares communication number, interaction strength, and pathway-level differences between two CellChat result objects.
The input consists of the .rds files generated by the CellChat workflow, allowing direct comparison of ligand-receptor communication across experimental conditions.
Workflow overview
Load and harmonize the CellChat objects Read one or two CellChat result objects (
.rds) and align cell identities across them usingliftCellChatso that downstream comparison is valid even when some cell groups differ between objects.Compare global interaction number and strength Merge the aligned objects with
mergeCellChatand compare the total number of interactions and overall interaction strength between conditions.Analyze network topology differences Generate differential network plots that show which cell-cell communication links are increased or decreased between conditions.
Compare pathway remodeling and signaling roles Use RankNet-style comparisons to identify pathway-level changes and evaluate how signaling roles shift across cell types between conditions.
Refine ligand-receptor-level comparisons and export results Use user-specified pathways and source/target cell sets to generate targeted comparison bubble plots, gene expression plots, and optionally a merged CellChat object for further custom analysis in R.
Prepare sample.txt
Scenario 1: in-depth visualization of a single CellChat object
sample_id   input_path
Colon_Cancer_P2_008um results/Colon_Cancer_P2_008um/cellchat/cellchat.rds
Scenario 2: comparison of two experimental conditions
sample_id   input_path
Tumor       /abs/path/tumor_cellchat.rds
Normal      /abs/path/normal_cellchat.rds
Input requirements:
The second column must contain a valid
.rdspath.You may provide one or two
.rdsfiles. A single object is used for deep visualization, whereas two objects are used for comparative analysis.Display names can be set through
cellchat_compare_sample_name1andcellchat_compare_sample_name2.For two-object comparison, using a consistent cell-type naming scheme is strongly recommended to minimize interpretation bias introduced during alignment.
Run the command
spatialsnake compare_analysis sample.txt visium --option=compare_stage --runpipe=cellchat
Optional configuration
For the configuration reference, see compare_stage.yaml Reference.
cellchat_compare_output_dir: "results/compare_cellchat"   # output directory
cellchat_compare_sample_name1: ""                         # display name for sample 1
cellchat_compare_sample_name2: ""                         # display name for sample 2
cellchat_compare_pathways: "MIF"                          # comma-separated pathways, for example "CXCL,CCL"
cellchat_compare_source_cells: "Tumor_I,Tumor_III"        # comma-separated source cell types
cellchat_compare_target_cells: "Tumor_I,Tumor_III"        # comma-separated target cell types
cellchat_compare_receiver_cells: "Tumor_I,Tumor_III"      # receiver cells for netVisual_aggregate
cellchat_compare_bubble_angle: 45                         # x-axis angle for comparison bubble plots
cellchat_compare_bubble_remove_isolate: True              # whether to remove isolated nodes
cellchat_compare_do_ranknet: True                         # whether to output RankNet comparison
cellchat_compare_do_role_heatmap: True                    # whether to output signaling-role heatmaps
cellchat_compare_do_pathway_plots: True                   # whether to output pathway summary plots
cellchat_compare_do_compare_overview: True                # whether to output overview comparison plots
cellchat_compare_do_compare_bubble: True                  # whether to output comparison bubble plots
cellchat_compare_do_single_bubble: True                   # whether to output per-sample bubble plots
cellchat_compare_do_gene_expression: True                 # whether to output plotGeneExpression
cellchat_compare_gene_colors: "white,#FEC44F,#D95F0E"     # color gradient for plotGeneExpression
cellchat_compare_gene_plot_type: "dot"                    # dot or heatmap
cellchat_compare_pair_lr_use: "SPP1_CD44"                 # pairLR used for spatial feature plots
cellchat_compare_save_merged: True                        # whether to save the merged CellChat object
Result file structure
Scenario 1: one input .rds file (deep visualization of one CellChat object)
results/
└── compare_cellchat/
    ├── {sample}_aggregate_hierarchy.png
    ├── {sample}_aggregate_chord.png
    ├── {sample}_pathway_heatmap.png
    ├── {sample}_pathway_contribution.png
    ├── {sample}_bubble.png
    ├── {sample}_selected_bubble.png
    ├── {sample}_signaling_role_network.png
    ├── {sample}_signaling_role_scatter.png
    ├── {sample}_signaling_role_outgoing.png
    ├── {sample}_signaling_role_incoming.png
    ├── {sample}_spatial_feature_pairlr.png
    └── {sample}_gene_expression.png
Scenario 2: two input .rds files (comparative CellChat analysis across conditions)
results/
└── compare_cellchat/
    ├── compare_overview_number_strength.png
    ├── compare_diff_number_strength_net.png
    ├── compare_heatmap_count_weight.png
    ├── compare_pathway_strength.png
    ├── compare_signaling_role_all.png
    ├── compare_signaling_role_outgoing.png
    ├── compare_signaling_role_incoming.png
    ├── compare_lr_regulated.png
    ├── compare_pathway_aggregate_hierarchy.png
    ├── compare_pathway_aggregate_chord.png
    ├── compare_pathway_heatmap.png
    ├── compare_pathway_contribution.png
    ├── cellchat_object.list.rds
    └── cellchat_merged.rds
Notes on one-object versus two-object mode:
A single-object run does not generate cross-condition outputs such as
compare_overview,diffInteraction, ormerged.rds. Instead, it produces deeper visualization of that one object.A two-object run enters the comparative workflow and emphasizes interaction number and strength differences, differential network topology, pathway remodeling, and signaling-role shifts.
source_cells,target_cells, andpathwayscan be specified in both modes. If they are not provided, the script falls back to available defaults.
How to interpret the results
1. Overview of interaction number and strength
Interpretation: This side-by-side bar plot compares the global communication landscape between two experimental conditions and provides a rapid overview of whether communication is globally reduced or enhanced.
2. Differential network topology plot
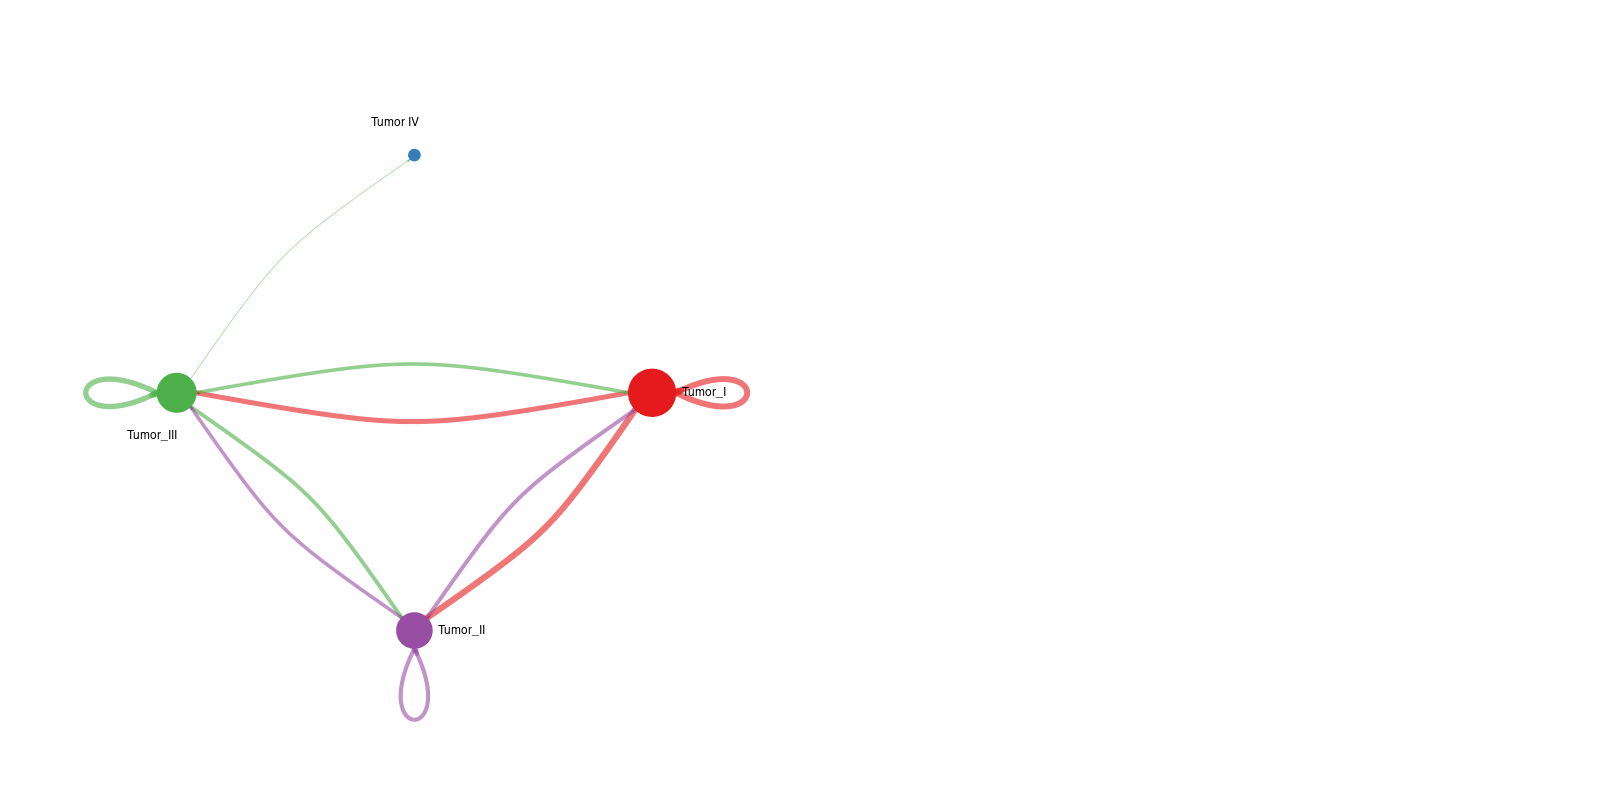
Interpretation: This network plot highlights differences in communication number or strength between specific cell pairs. Red edges represent interactions increased in condition 2 relative to condition 1, whereas blue edges represent decreased interactions.
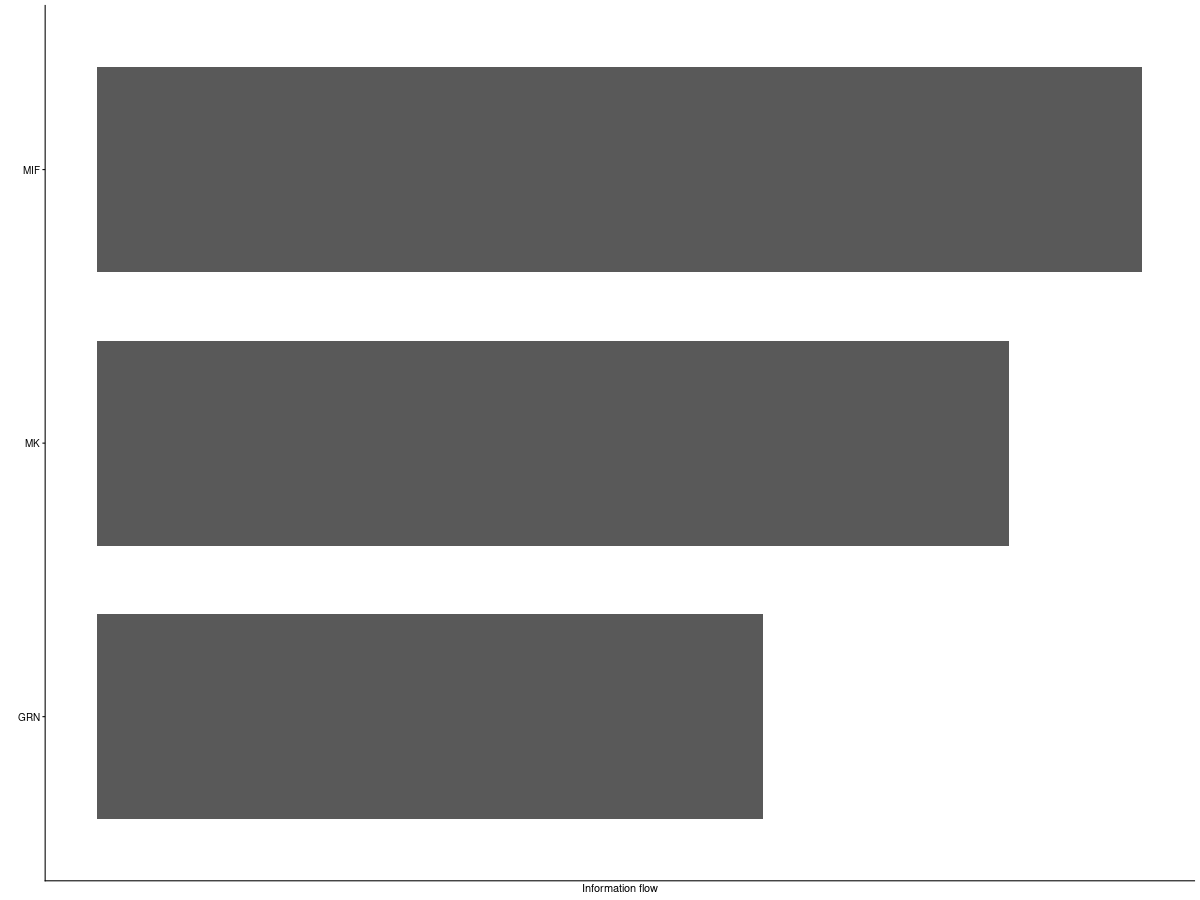
3. Pathway strength comparison plot
Interpretation: This RankNet-style figure compares pathway-level information flow and reveals which signaling pathways are specifically increased or decreased in one condition.
4. Differential ligand-receptor bubble plot
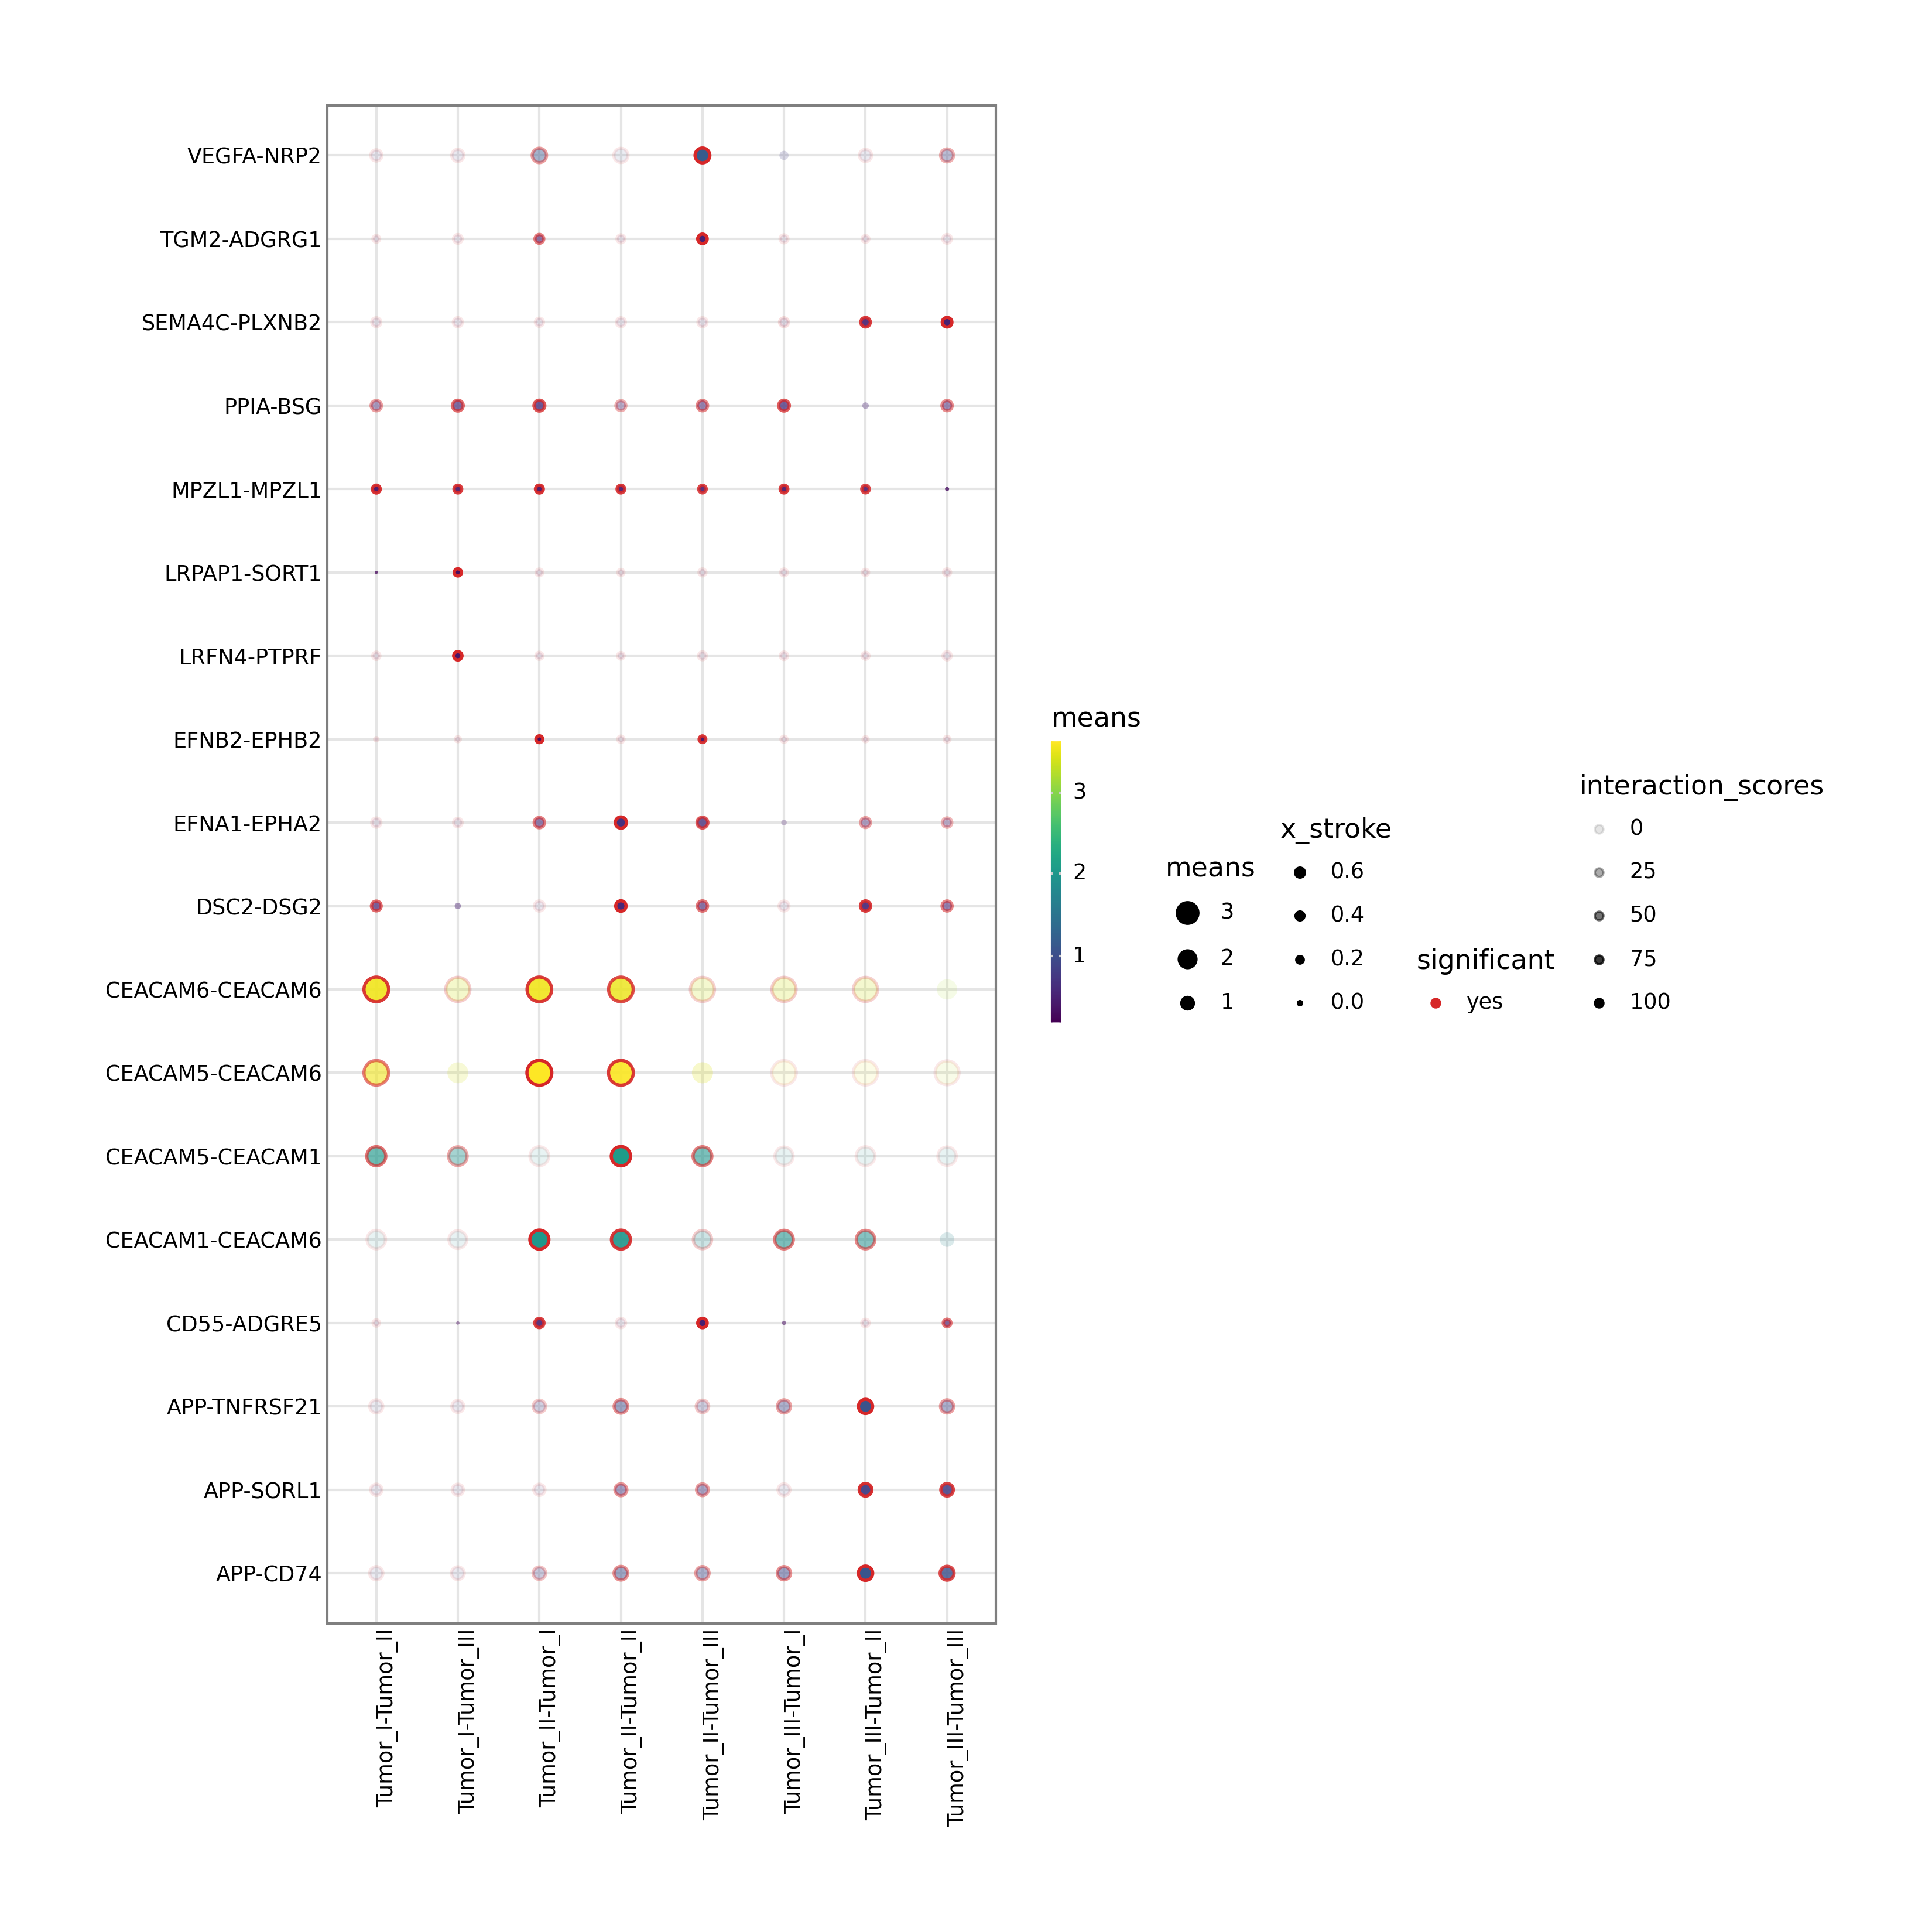
Interpretation: This figure highlights ligand-receptor pairs that are significantly regulated between the selected source and target cell populations. Bubble size represents significance and color represents communication probability, making the plot especially useful for mechanistic validation and target prioritization.
5. Merged CellChat object
Interpretation: This is a standard CellChat R object containing the aligned and merged results from the compared samples. It can be loaded directly into R for additional custom visualization using the official CellChat package, such as gene-level violin plots or pathway-specific chord diagrams.