Module 3: Cell-Cell Communication (liana)
Although Spatialsnake already provides ligand-receptor analysis through Module 1: Cell-Cell Communication (cellPhoneDB) and CellChat, we also include liana because it offers a broader and more flexible cell-cell communication inference framework.
liana can run multiple ligand-receptor scoring methods through a unified interface and write the results back into the analysis object for convenient downstream reuse.
This multi-method integration design can provide a more robust view of intercellular communication than a single algorithm alone.
Note that liana does not explicitly model spatial distance in the same way as spatially constrained methods.
If spatial proximity is central to the biological question, it is advisable to first restrict the analysis to a smaller region of interest (ROI) and then run liana on that subset.
liana is also suitable for jointly interpreting spatial and single-cell data under comparable experimental conditions, helping to compare communication patterns across different modalities.
For the complete parameter configuration reference, see advance_analysis.yaml Reference.
Read the input object and parse the grouping parameters.
Run LIANA communication inference using the selected method.
Filter and summarize high-confidence ligand-receptor interactions.
Automatically generate summary visualization figures.
Export the object containing the communication results for downstream analysis.
Specifically, the pipeline reads the spatial or single-cell object (.zarr or .h5ad), extracts the specified cell-type annotation column as the grouping basis, and then runs LIANA methods such as cellphonedb, connectome, and cellchat according to the configuration, combining resource databases and expression thresholds to filter low-expression features. It then retains high-confidence interactions, writes important scores to .uns, and finally automatically generates dot plots, tile plots, and, when conditions allow, circle plots.
The recommended sample.txt format is shown below. For single-cell data, replace the path with the corresponding .h5ad file.
sample_id   input_path
{sample_id} results/{sample_id}/annotation/{sample_id}.zarr
Input requirements:
The input object should contain a cell-type annotation column, typically
celltype.It is strongly recommended to use a well-annotated object to ensure that the sender and receiver cell populations are biologically interpretable.
step 1: sample.txt configuration file
Prepare a sample.txt file containing the sample ID and the input object path to start the LIANA analysis.
Step 2: Parameter Selection and Configuration
The commonly used parameters that are worth understanding first in advance_analysis.yaml include:
Parameter |
Typical values |
Description |
|---|---|---|
|
|
Specifies the current advanced analysis branch as LIANA |
|
|
Input object path |
|
|
Selects the communication scoring method |
|
|
Specifies the ligand-receptor resource database |
|
|
Expression proportion threshold for filtering low-expression ligands and receptors |
|
|
Minimum number of cells required per cell population |
|
|
Whether to preferentially use the expression matrix in |
|
|
Column name used for cell-type grouping |
Configuration recommendations:
liana_methodis one of the most critical parameters, as it determines the communication scoring logic. If consistency with a classic analysis pipeline is desired,cellphonedbcan be used first; if multi-method comparison or screening candidate interactions from different statistical perspectives is preferred, other methods may be tried.liana_resource_namedetermines the ligand-receptor database source. For routine analysis, starting withconsensusis generally recommended.liana_expr_propandliana_min_cellsjointly determine the filtering stringency. Overly high thresholds may miss rare but important signals; overly low thresholds may introduce noise.celltype_colmust match the actual annotation column in the input object; otherwise sender and receiver populations cannot be correctly constructed.
Before running the command, it is recommended to confirm whether the above parameters in advance_analysis.yaml already match the current object.
Step 3: Run the Command
spatialsnake single_analysis sample.txt visium --option=advance_analysis --runpipe=liana
Because liana is primarily designed for single-sample analysis, spatial context should be considered carefully when it is applied to spatial transcriptomics data; the full sample may not always be the most appropriate input.
For illustration, we use the tumor-subcluster zarr result from the reannotation step. This subset may still not be optimal for every dataset, so please adjust the input according to your specific study design.
Prepare the appropriate subset from your own data before running the analysis.
1. Prepare the input object
samples path_to_dir
Colon_Cancer_P2_008um results/Colon_Cancer_P2_008um/reannotation/Colon_Cancer_P2_008um.zarr
2. Set the key parameters
Prioritize confirming liana_method, liana_resource_name, liana_expr_prop, liana_min_cells, and celltype_col. These parameters determine method selection, database source, expression filtering stringency, and grouping logic.
3. Run LIANA
spatialsnake single_analysis sample.txt visium_HD --option=advance_analysis --runpipe=liana
Appendix: Supported liana_method values
The pipeline currently supports the following method names directly:
cellphonedb: Evaluates ligand-receptor significance based on mean expression and permutation logic.connectome: Emphasizes network connectivity and edge strength.natmi: Focuses on cell-type-specific ligand-receptor characteristics.singlecellsignalr: Uses LRscore-style ranking for rapid prioritization.cellchat: Employs probability-based scoring logic analogous to CellChat within the LIANA interface.geometric_mean: Uses the geometric mean for aggregation, mitigating the influence of extreme values.logfc: Emphasizes expression fold-change magnitude, suitable for analyses focused on differential expression.rank_aggregate: Performs rank aggregation across multiple methods to obtain consensus scores.scseqcomm: Provides an alternative statistical perspective for evaluating candidate interactions.
Notes:
log2fcis automatically mapped tologfc.cellphone_dbis automatically mapped tocellphonedb.Other method names are validated against the locally installed version of LIANA.
Appendix: Recommendations for liana_resource_name
consensus(default): The LIANA integrated resource, suitable for most routine analyses and tutorial use cases.Other resource names: LIANA can switch between different databases depending on the local version and installed resources. Choose a specific database when strict consistency with a particular publication or legacy pipeline is required.
It is recommended to start with consensus and only switch to a specific resource when comparability with prior work is essential.
Result file structure
results/
└── liana_output/
    ├── {sample}.zarr
    ├── dotplot.png
    ├── tileplot.png
    └── circle.png
Here, circle.png is generated only when the cell-type labels in the input object can be stably matched to the source and target labels in the LIANA results. If the mapping is insufficient, the pipeline will preferentially retain dotplot and tileplot and skip the circle plot to avoid interrupting the workflow.
1. Ligand-receptor dot plot
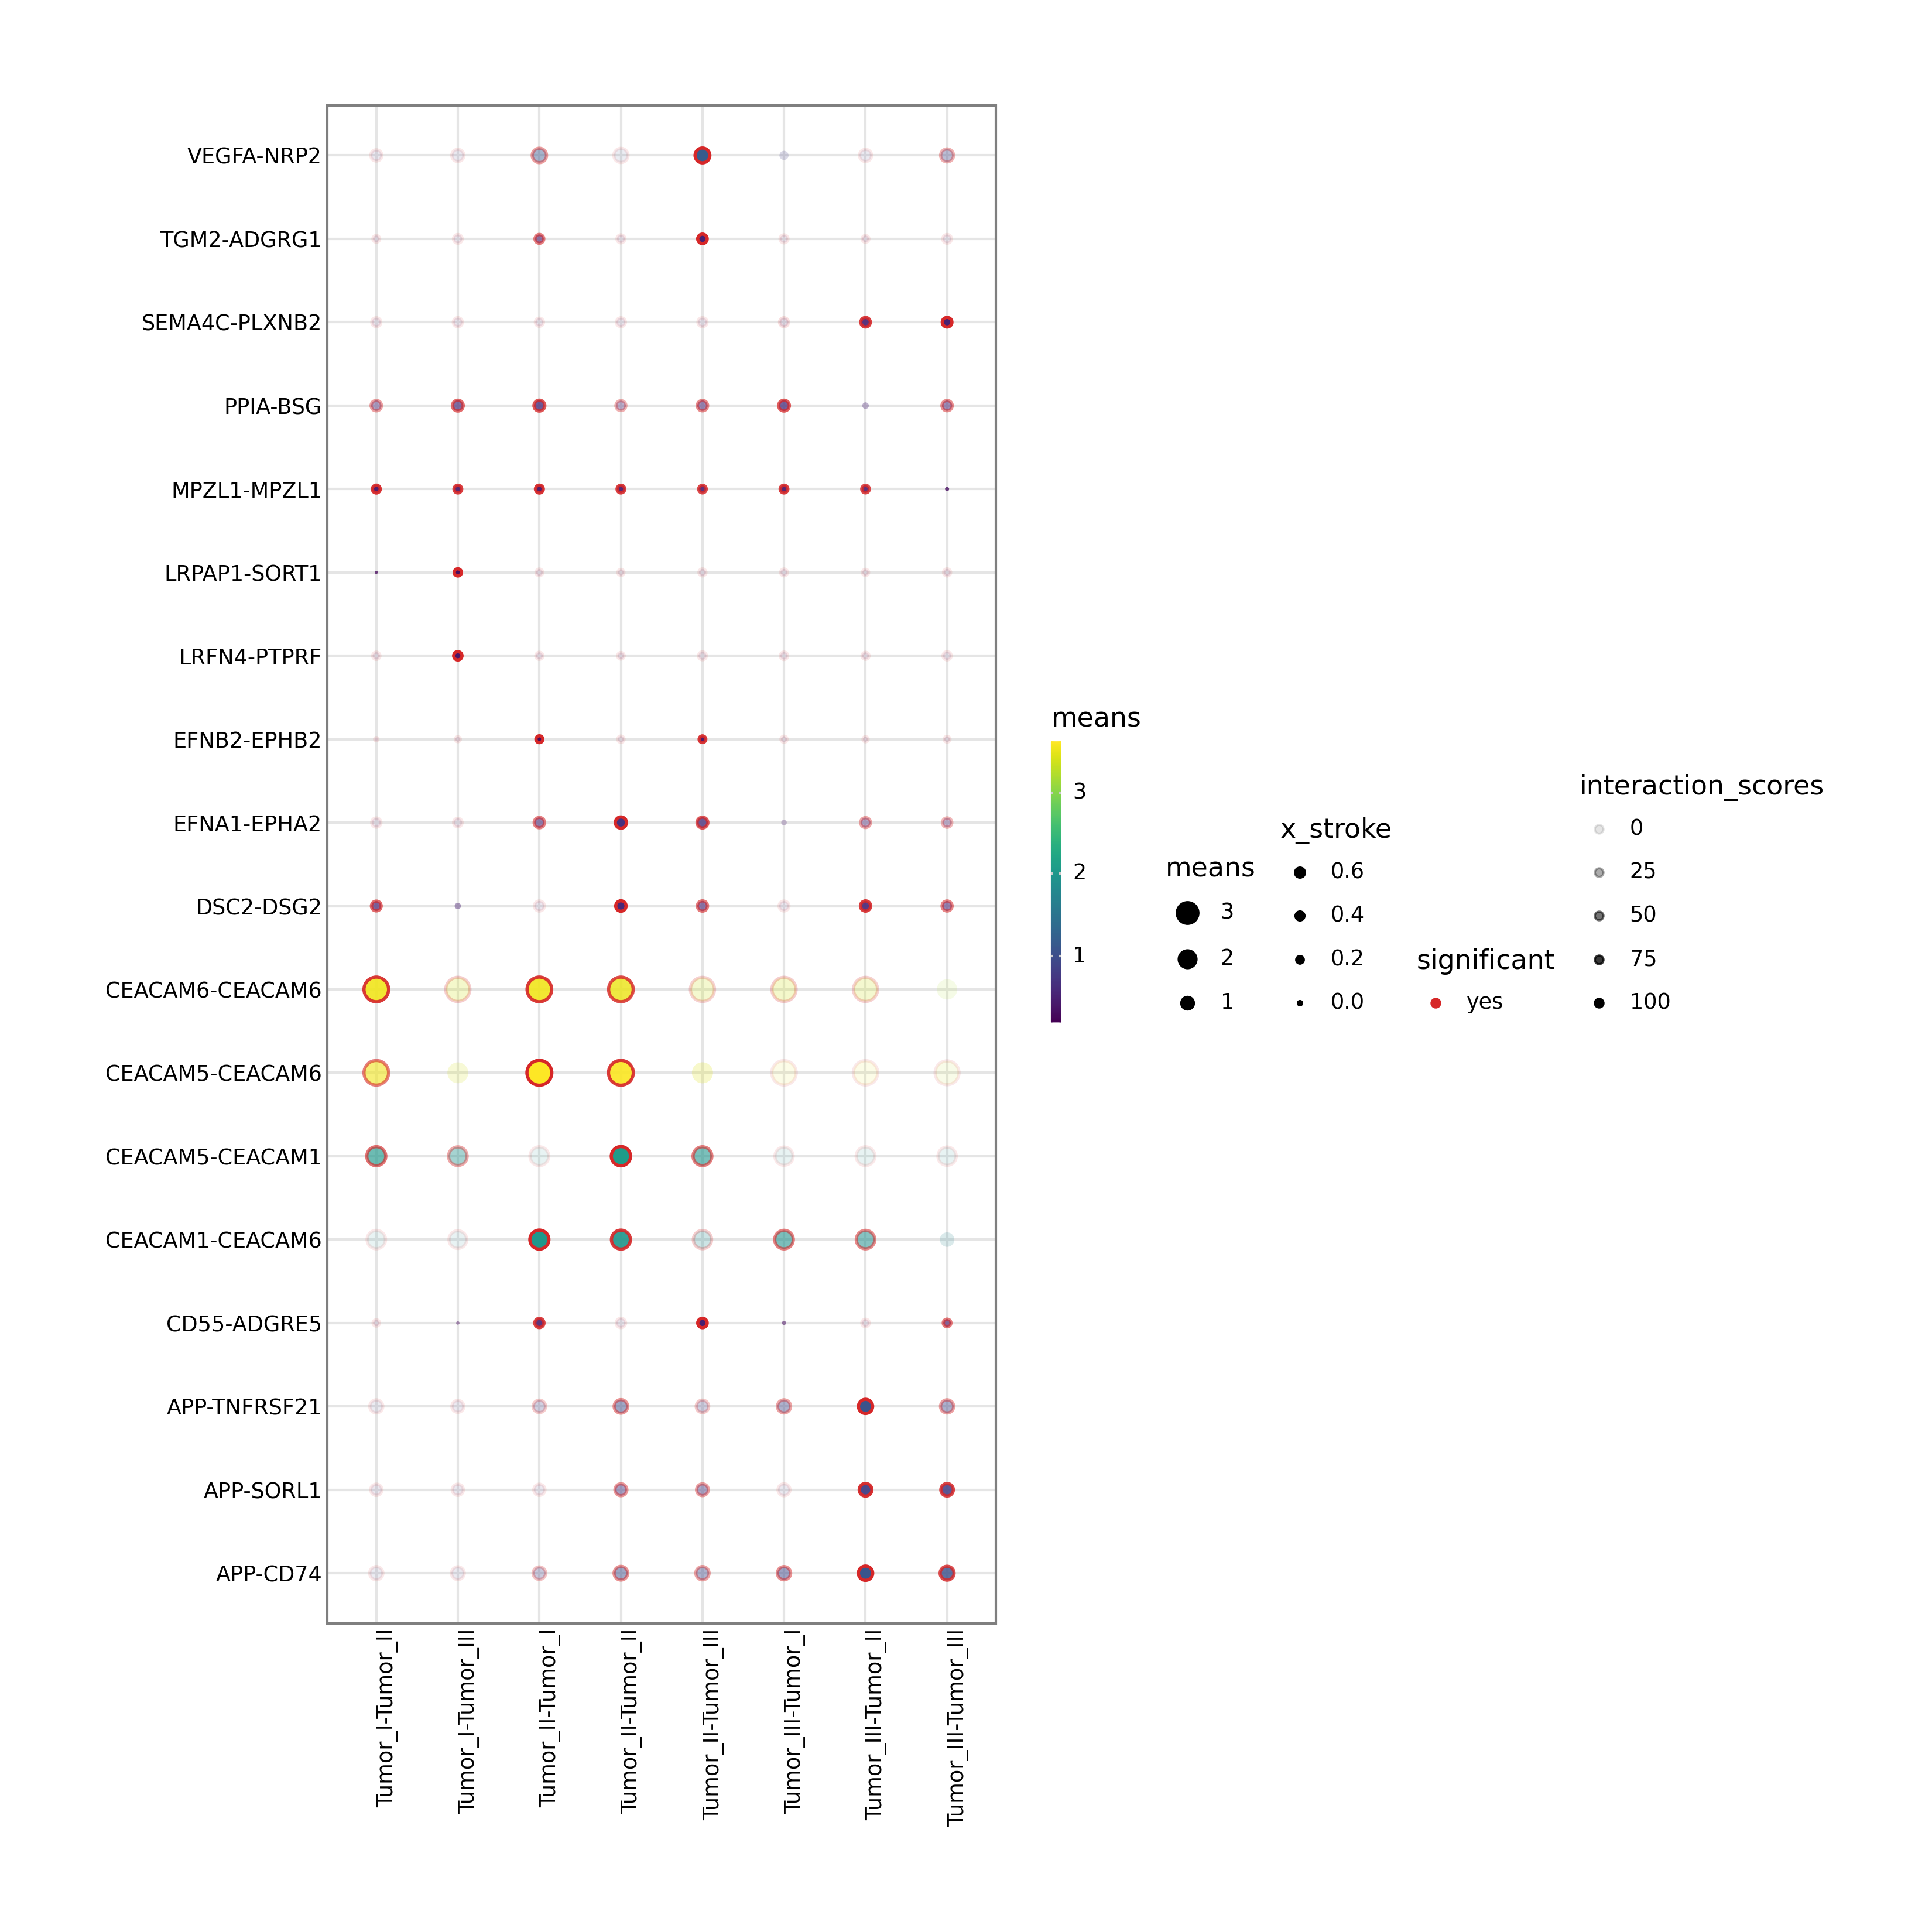
This figure displays specific ligand-receptor interactions between selected source and target cell populations. Dot size typically reflects significance (e.g., negative log10 p-value), while color reflects interaction strength. It is one of the most important figures for mechanism-oriented interpretation.
2. Heatmap of ranked interactions
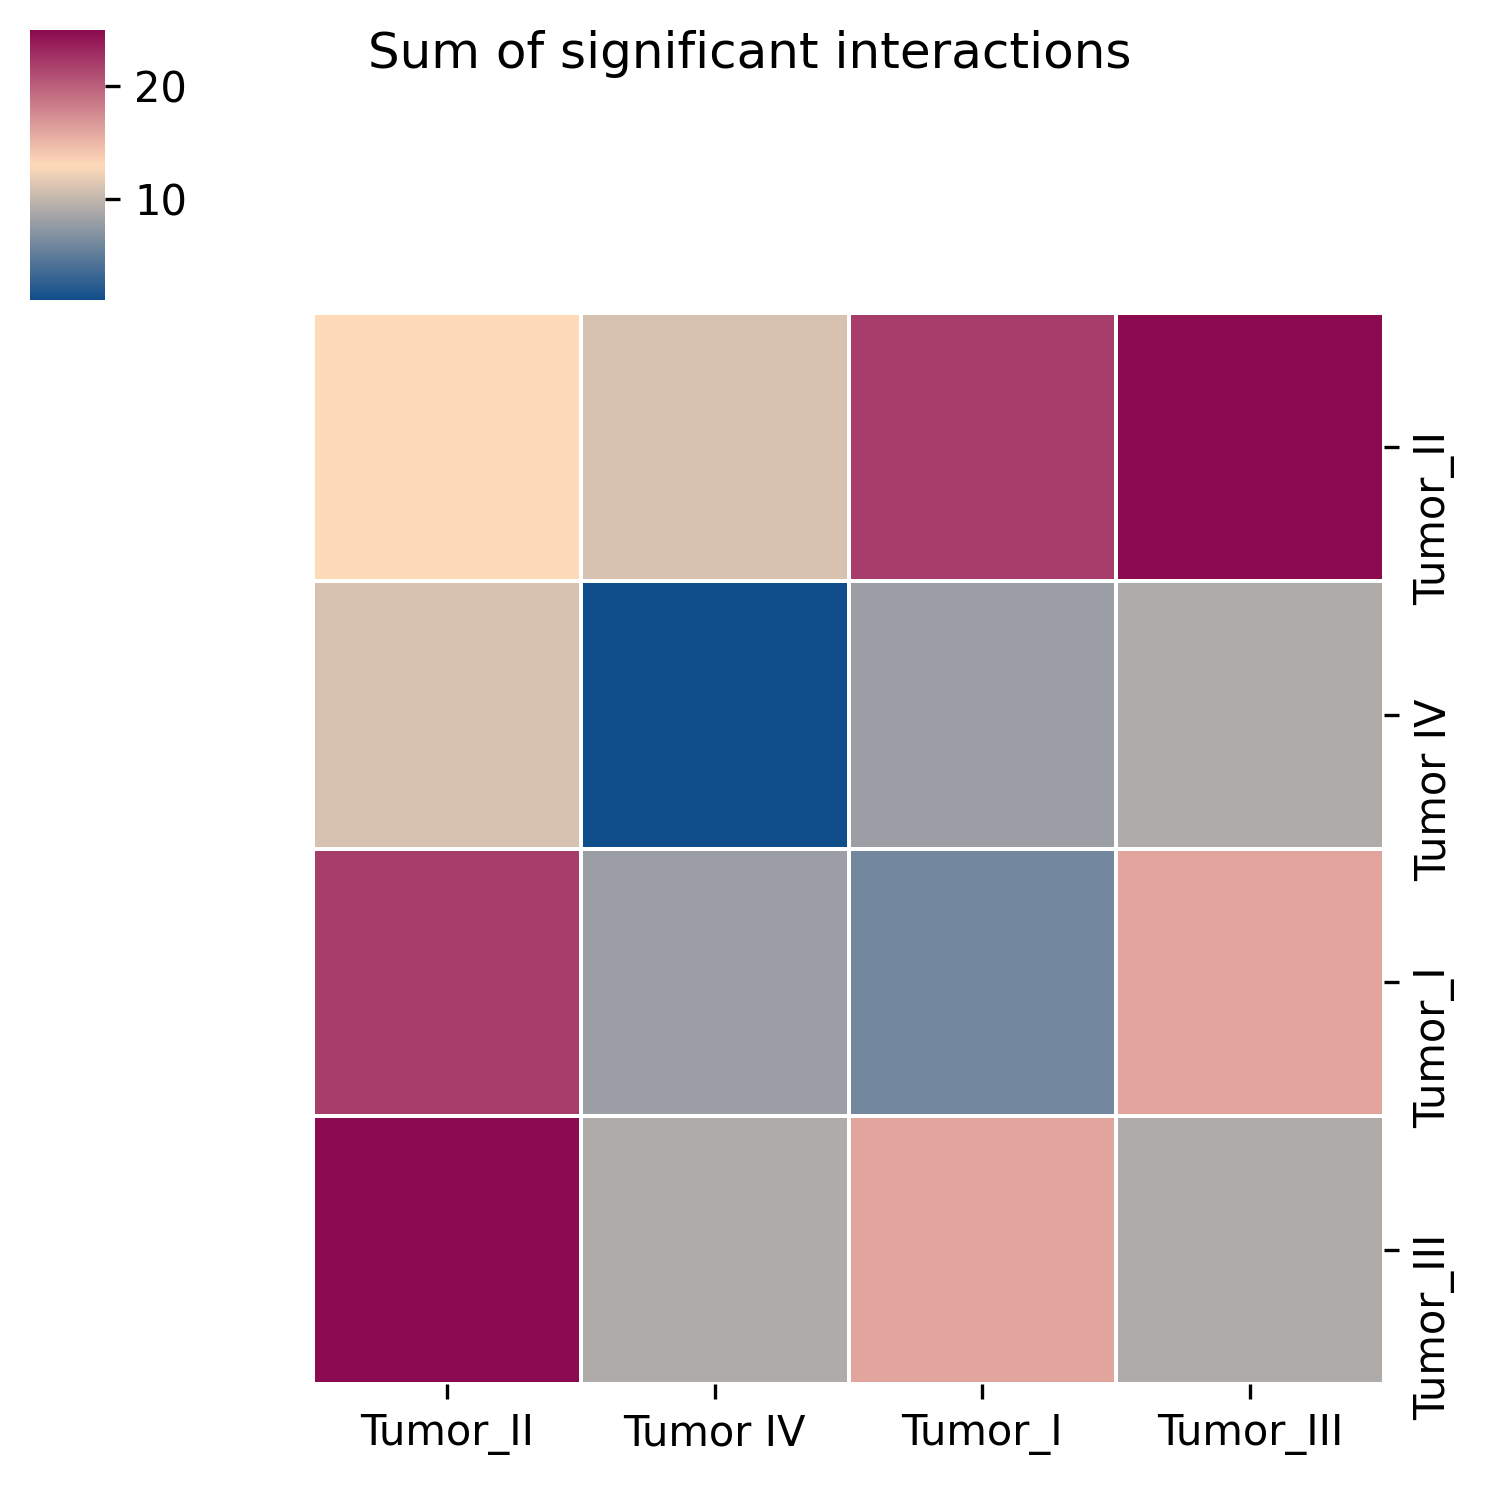
This figure highlights the top-ranking ligand-receptor interactions across the full dataset or for specific cell pairs. The fill color represents interaction strength, helping to rapidly identify the communication axes that most deserve attention.
3. Global communication circle plot

This figure summarizes the communication network among all cell types at a global level. Nodes represent cell populations, and edge thickness and color reflect the number and overall strength of interactions. It is particularly useful for identifying potential communication hubs within the tissue microenvironment.
4. Communication result object
The complete LIANA result table is typically written to the .uns slot of the result object. Advanced users can further load the object, extract the raw numerical results, and perform custom filtering, visualization, or extended analysis within the Scanpy or SpatialData ecosystem.