Secondary Clustering (reclustering)
Spatial transcriptomics studies often require more detailed subcluster annotation than can be achieved in the initial clustering step. Because the original clustering is limited by the selected resolution and number of PCs, it may not separate subtle subpopulations well.
For this reason, Spatialsnake provides reclustering to refine a target cell population at higher resolution.
Workflow overview
Read the input
.zarrobject and extract the first table as the reclustering target.Build the neighbor graph from PCA and run Leiden clustering again, writing the new labels to
obs['recluster'].Export the reclustered UMAP plot and spatial distribution plot.
Compute and export subcluster marker results with the selected thresholds.
Export the subcluster assignment table and write the updated labels back into a new
{sample}.zarrobject for downstream reuse.
Here we use the manually annotated Colon_Cancer_P2 dataset as an example.
We first select a cell population of interest. In this case, we isolate the Tumor compartment in order to resolve finer malignant subclusters.
Important
Before starting this step, make sure your data have already been split according to the cell type of interest. If you have not yet done so, read Utility Tools, or use the command below to create the subset. Because this module repeats the post-normalization analysis pipeline in order to identify finer cell-type labels, we use the example data directly here. For other scenarios, adjust the required parameters and paths according to your dataset.
1.Split the object
Select the cell type to be subdivided directly, for example the Tumor population, by setting --barcodes=Tumor. If multiple cell types need to be split, list them in order and separate them with commas. For detailed instructions, refer to Utility Tools.
spatialsnake useful_tool --option=splitting results/Colon_Cancer_P2_008um/annotation/Colon_Cancer_P2.zarr --split_by=celltype --barcodes=Tumor
Then prepare sample.txt using the output under results/useful_results.
If you wish to use the same parameters to subcluster multiple cell types simultaneously, add additional sample_id and input_path rows to sample.txt; Spatialsnake will process them in parallel using multiple threads.
sample_id input_path
Colon_Cancer_P2_008um results/useful_results/celltype_selected_Tumor.zarr
During reclustering, cellular heterogeneity within the subset is smaller, so it is recommended to use relatively low resolution and n_pcs values to avoid over-clustering.
2.Optional parameters through a configuration file
To keep the reclustering strategy reproducible across multiple runs, use a YAML configuration file.
See reclustering.yaml Reference for the parameter reference.
The template lets you manage settings such as recluster_resolution, recluster_n_pcs, and recluster_marker_method in a versioned and reproducible way.
Generate the YAML template with:
spatialsnake produce-file --option=reclustering
3.Run the command
spatialsnake single_analysis sample.txt visium_HD --option=reclustering --recluster_resolution=0.4 --recluster_n_pcs=15
or
spatialsnake single_analysis sample.txt visium_HD --option=reclustering --configfile=reclustering.yaml
Result file structure
This example shows single-sample reclustering. Before interpreting the subcluster structure, first confirm that marker_genes.csv and cluster_assignments.csv have been generated.
results/
└── {sample}/
    └── reclustering/
        ├── {sample}.zarr/
        ├── umap_recluster.png
        ├── spatial_clusters.png
        ├── marker_genes.csv
        └── cluster_assignments.csv
The file {sample}.zarr contains the new recluster labels. marker_genes.csv and cluster_assignments.csv are the main files used for downstream subcluster annotation and comparison.
How to inspect the reclustering results
umap_recluster.png(subcluster structure)Use this plot to assess whether the subclusters are separated clearly.
If many fragmented micro-clusters appear, the resolution may be too high.
If subclusters remain overly mixed, increase the resolution gradually and compare stability.
spatial_clusters.png(spatial subcluster map)Use this plot to check whether subclusters occupy biologically plausible spatial locations in the tissue.
If one subcluster is highly fragmented without a clear explanation, rerun with adjusted parameters.
Subclusters with locally coherent spatial distributions are usually easier to interpret biologically.
marker_genes.csv(subcluster marker table)This table is one of the main sources of evidence for naming subclusters.
Prioritize genes that are stably enriched in the target subcluster and consistent with the literature.
Interpret the table together with the images rather than relying on a single type of evidence.
cluster_assignments.csv(label assignment table)This file records the assigned subcluster label for each cell or spot.
It is a key bridge file for manual naming and downstream comparison.
Check for extremely small subclusters before proceeding, as they can lead to unstable downstream statistics.
Input requirements and common pitfalls
Before reclustering, make sure the input object is well defined and structurally complete.
If the upstream object is unstable, the subcluster results will also be unstable.
Always confirm that the original clustering is interpretable before refining it further.
Example figures
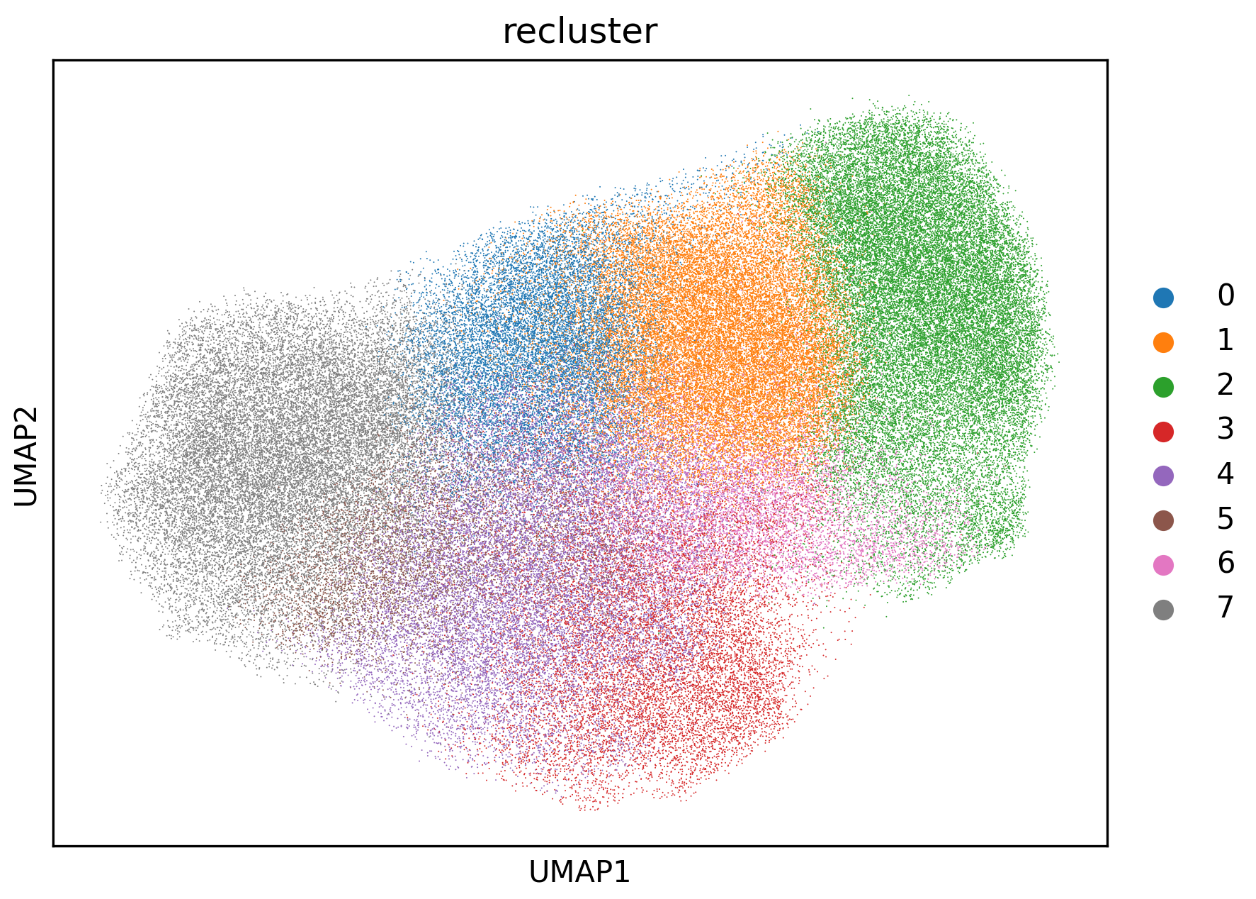
Reclustering UMAP plot showing whether the subclusters are clearly separated or excessively fragmented.
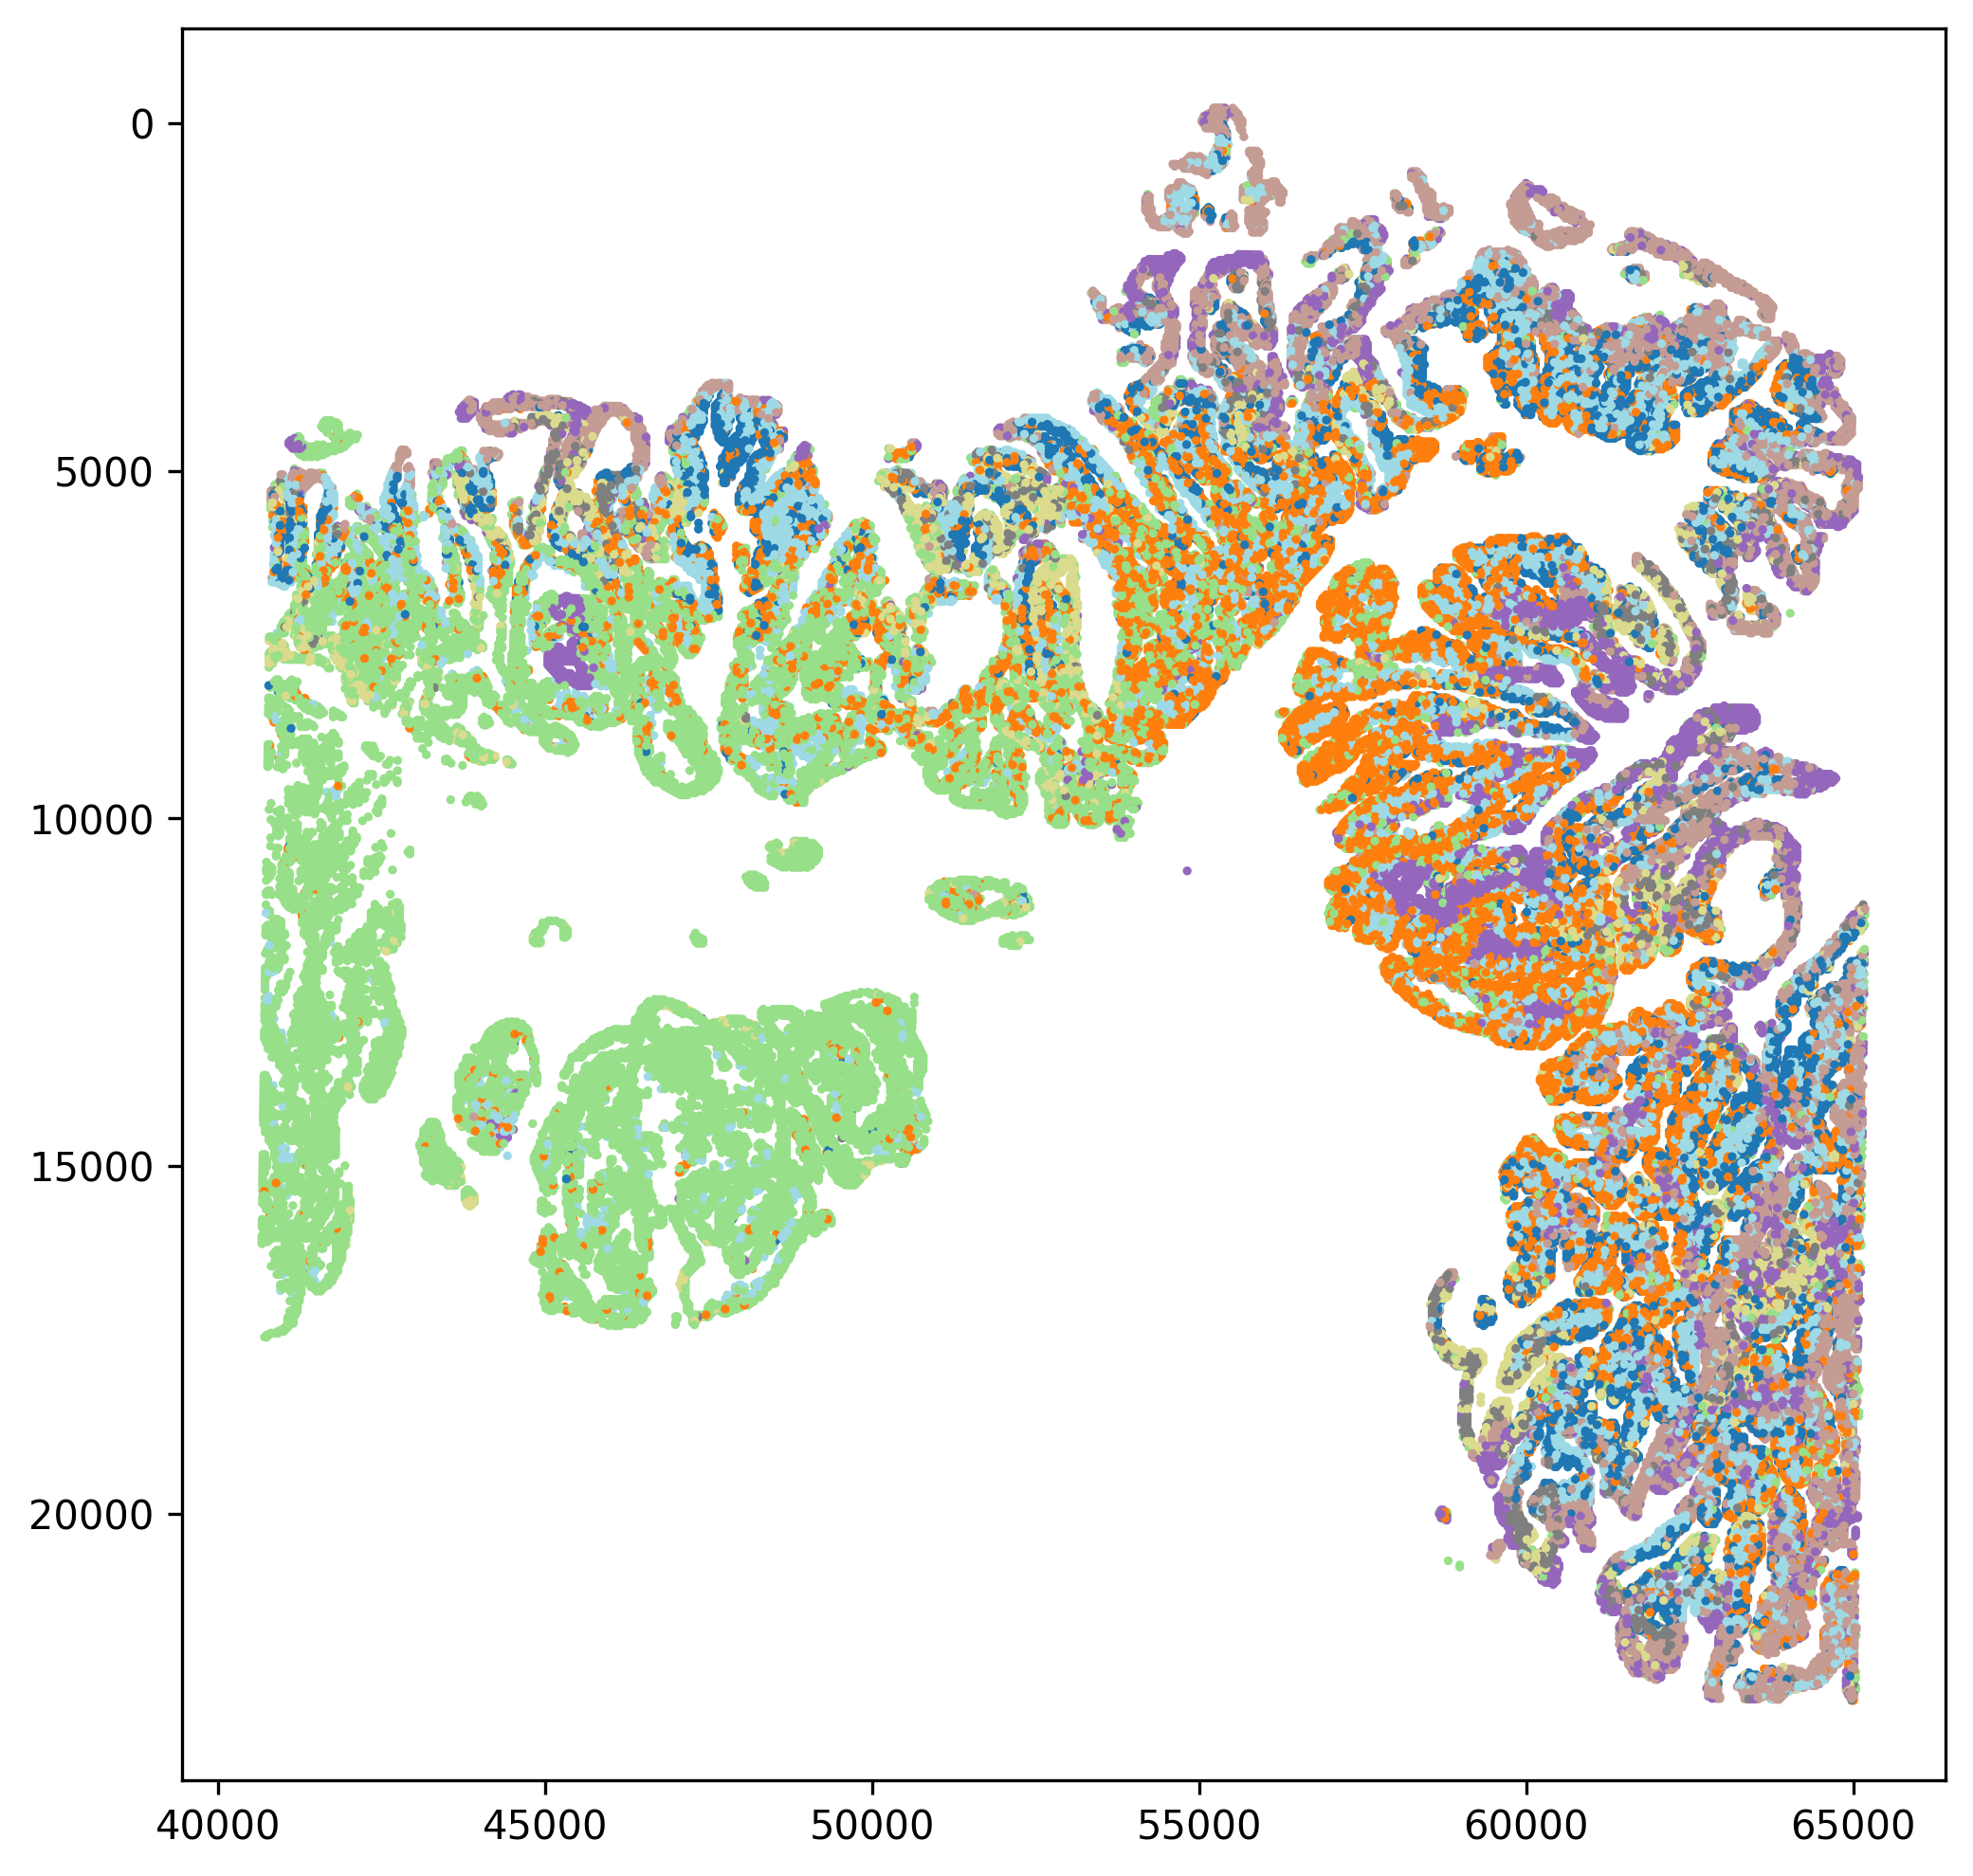
Spatial subcluster map showing spatial continuity and local enrichment patterns.
You can then use Reannotation (reannotation) to assign biological labels to the reclustered subpopulations, following the same logic as before with marker-based interpretation.